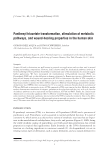
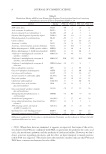
PANTHENYL TRIACETATE TRANSFORMATION 3 MATERIALS AND METHODS SUBSTANCES D-panthenyl triacetate (Induchem AG, Volketswil, Switzerland) and D-panthenol (Dai- ichi Fine Chemical, Takaoka, Japan) were tested diluted in either a water-based gel or in different emulsions. RAMAN SPECTROSCOPY ON THE SKIN OF HUMAN VOLUNTEERS Human volunteers (n = 3) applied three different products on three different areas on the volar side of the forearm: a water-based gel control, a water-based gel containing 3% PTA, and a water-based gel containing 3% PAN. The applied volume of the product was 2 mg/ cm2. The treated areas were measured by confocal Raman microspectroscopy (3510 Skin Composition Analyzer, River Diagnostics BV, Rotterdam, The Netherlands) one hour, fi ve hours, and 24 hours after application. The measurements were taken to a depth of approxi- mately 25 μm in the skin, covering the whole stratum corneum and a small layer (+/- 5 μm) in the viable epidermis. Ten repeated measurements were taken to obtain an average for the heterogeneity of the skin. The results were expressed as milligrams per active/gram of kera- tin versus the skin depth. The results were averaged for all three volunteers. HUMAN SKIN EXPLANTS AND TREATMENT Twelve skin explants were prepared from an abdominal skin biopsy removed in plastic surgery adipose tissue was removed, and the skin was cut off (5 cm2), placed in DMEM medium (10% FCS) into six-well plates, and maintained at 37°C, 5% CO2, humidity controlled. The medium was then replaced by new medium, and different products were topically applied on the epidermis in the plates. The products were a placebo cream, cream containing 2% PAN, and cream containing 2% PTA. The plates were then incu- bated for six or 24 hours. Untreated skin explants were used as controls in parallel. After each incubation period, three punches were performed on each skin explant and washed in phosphate buffer saline (PBS). The epidermal tissue was removed from the punches and immediately frozen at -80°C for further mRNA extraction. QUANTITATIVE RT-PCR ANALYSIS The mRNA of each segment of epidermis was extracted using Tri-Reagent® (Ambion, Austin, TX). The contaminant DNA was removed by treatment with a “DNA-free” sys- tem kit (Ambion), and reverse transcription of mRNA was conducted in the presence of oligo(dT) and Superscript II reverse-transcriptase (Invitrogen, Carlsbad, NM). The mRNA of triplicates was pulled together. Twenty-seven markers of skin metabolism were analyzed (see Table II) by quantitative RT-PCR. A PCR (polymerase chain reaction) was performed in triplicate using the LightCycler® system (Roche Molecular Systems Inc., Pleasanton, USA). WOUND-HEALING DOUBLE-BLIND CLINICAL STUDY The double-blind study was conducted on 40 subjects (female and male) with normal, healthy skin. The 37 subjects who fi nished the study were of ages between 40.3 and 60.8 years

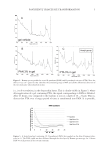
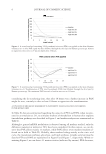
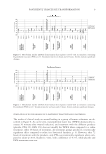
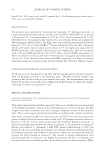
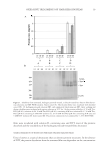
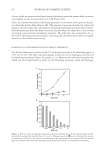
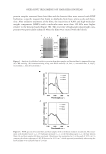
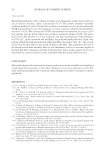
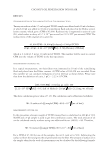
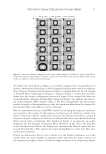
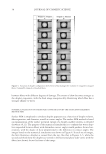
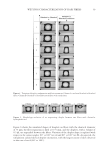
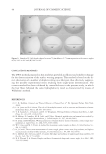
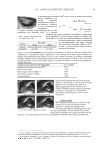
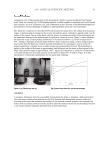
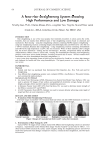
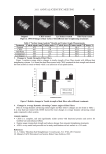
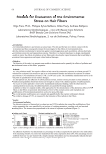
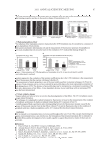
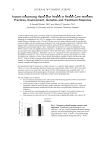
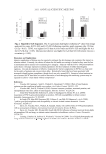
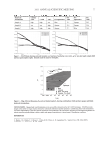
JOURNAL OF COSMETIC SCIENCE 4 (52.0 ± 5.5 years). Before starting the study there was a preconditioning period of three days. Within this period the use of skin care products on the volar forearms was not al- lowed. To generate small suction blisters of about 5-mm diameter on both volar forearms (two or three areas per forearm), a vacuum of 450–800 mbar was applied. Transepidermal water loss (TEWL) was detected after 30 min (T0), 48 hours (T48), and 72 hours (T72) from suction blisters. The treatments were immediately after formation of the suction blisters and consisted of an emulsion containing 3% PTA, an emulsion containing 3% PAN, an emulsion placebo, and saline. They were compared to each other and to an untreated area. Treatments were applied at 100 μl in occlusion using Finn Chambers on Scanpor® (Almirall Hermal, Reinbeck, Germany) over a period of 30 minutes, 48 hours, and 72 hours. All procedures were performed in a climate-controlled room at 21.5°C (± 1°C) and 50% (± 5%) relative humidity. STATISTICAL ANALYSIS To analyze the data from the clinical study, the intergroup comparisons were performed by Student’s t-test. The pair differences varied in their distribution, and so for compari- sons with the normally distributed pair differences, a t-test for dependent samples was used. The following table summarizes the statistical data obtained for all conditions tested: Comparison 48 hours 72 hours 3% PTA vs 3% PAN 0.8073 0.3153 3% PTA vs Placebo emulsion 0.6690 0.2727 3% PTA vs Saline 0.0001 0.0162 3% PAN vs Placebo emulsion 0.3488 0.7003 3% PAN vs Saline 0.0007 0.0620 Placebo emulsion vs Saline 0.0008 0.1962 Bold: statistically signifi cant differences. RESULTS D-PANTHENYL TRIACETATE AND D-PANTHENOL PENETRATION IN THE HUMAN SKIN As shown in Figure 2, the spectra profi les of the water-based gel (panel A), the PAN gel (panel B), and the PTA gel (panel C) differ when the gels are applied on the skin. Importantly, it is possible to detect a peak shift in the 1722 cm-1 region of the panel C spectrum that allows differential detection between PTA and PAN. This shift corresponds to the acety- lated groups present in PTA but not in PAN. In Figure 3 the depth penetration profi le of PAN is shown. PAN penetrates to a maxi- mum depth of 20 μm, which covers the whole stratum corneum. Five hours after applica- tion a rise is seen in the content in the skin, and deeper in the stratum corneum. Twenty-four hours after application, PAN is still present in the stratum corneum. In Figure 4 the depth penetration profi le of PTA is shown. Compared to PAN, PTA is detected mainly in the upper layer of the stratum corneum. After fi ve hours the product is diffused through the upper layers and the content is decreased. After 24 hours almost no active is visible in the skin. The reason, principally, is the conversion of PTA into PAN,
Purchased for the exclusive use of nofirst nolast (unknown)
From: SCC Media Library & Resource Center (library.scconline.org)