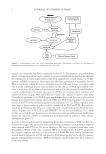
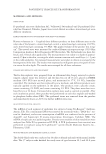
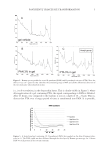
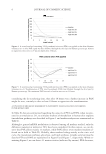
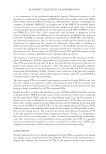
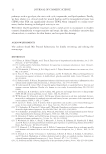
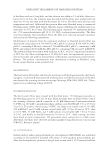
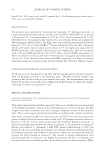
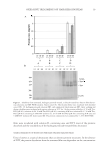
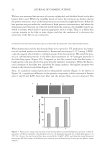
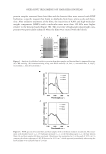
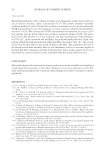
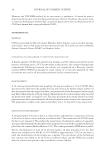
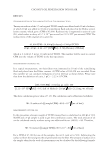
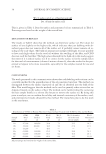
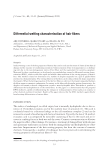
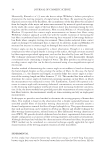
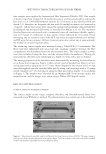
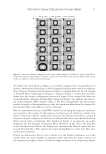
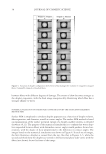
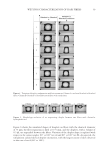
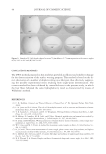
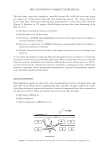
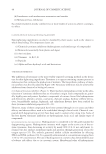
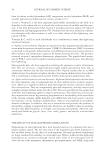
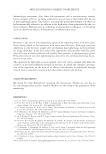
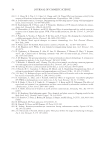
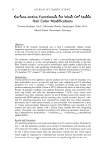
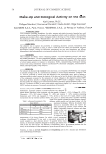
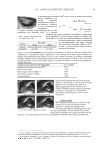
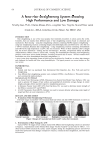
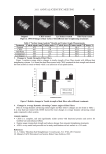
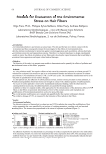
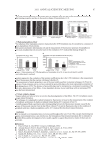
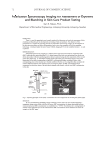
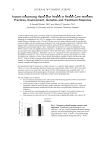
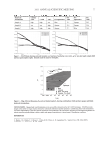
PANTHENYL TRIACETATE TRANSFORMATION 5 i.e., its de-acetylation, in the deeper skin layers. This is clearly visible in Figure 5, where after application of a gel containing PTA, the signal corresponding to PAN is followed. After 24 hours a rise compared to the baseline is seen at a depth of 10 – 24 μm. This in- dicates that PTA over a longer period of time is transformed into PAN. It is possible, Figure 2. Raman spectra profi les for tested D-panthenol (PAN) and D-panthenyl triacetate (PTA). Note the shift at 1722 cm–1 (panel C) that identifi es the acetylated groups of PTA and allows differential detection of the two molecules when absorbed in skin. Figure 3. A water-based gel containing 3% D-panthenol (PAN) was applied on the skin of human volun- teers (n=3). The PAN signal was then followed through the skin layer by Raman spectroscopy. At 24 hours PAN was still present in the stratum corneum.

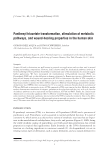
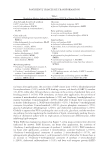
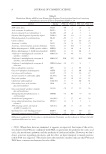
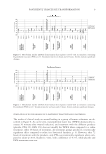
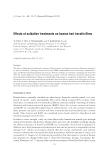
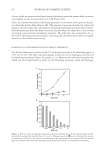
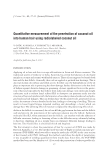
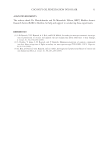
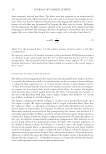
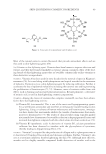
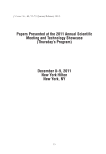
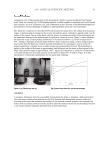
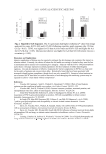
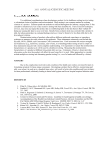
JOURNAL OF COSMETIC SCIENCE 6 considering the de-acetylating time, that after 48 hours even a further increase in PAN might be seen certainly it takes at least 24 hours to appreciate the transformation. ACTIVATION OF METABOLIC MARKERS BY D-PANTHENYL TRIACETATE AND D-PANTHENOL IN THE HUMAN SKIN In Table II, data are summarized regarding the capacity of PTA and PAN, when incorpo- rated in an emulsion at 2%, to stimulate markers of metabolism in human skin explants (metabolism pathways are described in Figure 1 and marker analyses are summarized in Table I). Although a general mRNA modulation is observed among all markers studied, only the differences superior or inferior at 50% have been considered. In this context, we can ob- serve that PTA affects mainly 11 markers, while PAN affects seven markers (markers af- fected are in bold in Table II). Globally, these markers belong mainly to the citric acid cycle, the mevalonate pathway, glycolysis, and lipid synthesis. Graphs summarizing the data for PTA and PAN are represented in Figure 6 and Figure 7, respectively. When ex- amining Figure 6, we can detect 11 main activities (indicated by arrows). PTA decreases, Figure 4. A water-based gel containing 3% D-panthenyl triacetate (PTA) was applied on the skin of human volunteers (n=3). The PTA signal was then followed through the skin layer by Raman spectroscopy. Almost no signal was detected at a 25-micron depth after 24 hours. Figure 5. A water-based gel containing 3% D-panthenyl triacetate (PTA) was applied on the skin of human volunteers (n=3). Transformation of PTA into D-panthenol (PAN) was followed through the skin layer by Raman spectroscopy. The maximum PAN increase vs baseline was seen at 24 hours.
Purchased for the exclusive use of nofirst nolast (unknown)
From: SCC Media Library & Resource Center (library.scconline.org)