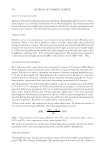
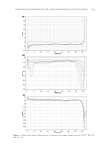
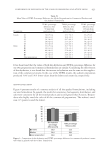
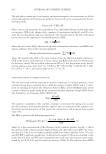
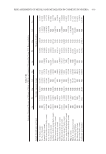
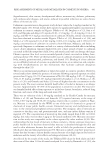
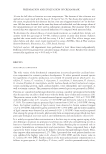
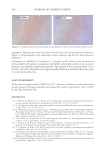
COMPARISON OF EMULSIONS IN THE CARE OF DEMANDING AND ATOPIC SKINS 421 Figure 2. Delta backscattered light intensity as a function of a sample height stored at (A) 8°C, (B) 40°C, and (C) 23°C.

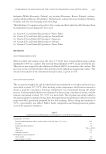
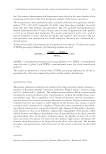
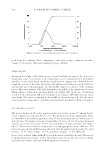
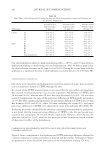
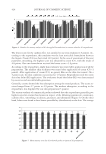
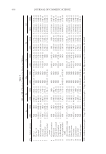
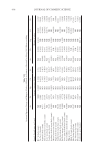
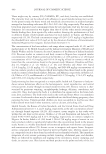
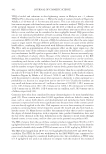
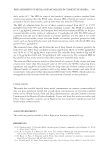
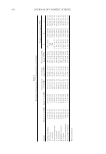
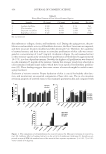
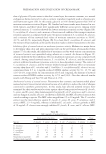
JOURNAL OF COSMETIC SCIENCE 422 Our own formulation showed a high moisturizing effect—58.7%—after 30 min from its application, ranking it third among all tested formulations. After 60 min of application, the skin hydration remained on the same level of 59.8%. During the second hour from the application, a signifi cant decrease in skin hydration was noted down to 34.2% (Table III). TRANSEPIDERMAL WATER LOSS One of the most important and fundamental criteria for analysis of atopic skin care prod- ucts is a parameter defi ned as TEWL through the skin. As a result of the TEWL measurements, it was noted that the most effective formulation was cream (C2) containing hemp oil as an active ingredient. The difference of TEWL after 30 min was 26.6%, whereas after 60 min, the value decreased to 10.0%. 120 min after cream (C2) application, the value of the percentage difference of TEWL gently increased to 14.2%. For other commercial preparations, the percentage difference of TEWL after 30 min was between 26.8% and 40.3%. After 120 min, excluding the cream (C2), the lowest percentage differences of TEWL were obtained for cream (C4) and balm (B3) (Table IV). Analyzing the results obtained for the emulsion containing interesterifi ed fat application, it was found that the mean percentage difference of TEWL in the fi rst and second mea- surement was comparable, 36.7% and 38.9%, respectively. However, after 120 min, the value was reduced to 23.0%, which at this point placed our formulation fourth in terms of the protective effect of the formulation. COMPARISON OF SKIN HYDRATION AND TEWL VALUES FOR OUR OWN FORMULATION AND COMMERCIAL PRODUCTS Figure 3 shows a comparison of skin hydration and TEWL percentage difference obtained for commercial products (creams and balms in general) and the authors’ formulation. Values are presented as means for all the time points of the measurement (during 120 min). Table III Mean Value of Skin Hydration Percentage Increase for All the Respondents Commercial Products and the Authors’ Formulation Preparation Increase in skin hydration after 30 min (%) Increase in skin hydration after 60 min (%) Increase in skin hydration after 120 min (%) Cream C1 45.6 ± 0.5 56.7 ± 0.5 45.9 ± 0.3 C2 37.5 ± 0.4 61.1 ± 0.4 52.5 ± 0.2 C3 37.8 ± 0.4 45.8 ± 0.4 37.7 ± 0.2 C4 27.3 ± 0.2 30.9 ± 0.3 26.2 ± 0.1 C5 74.6 ± 0.4 99.4 ± 0.6 84.1 ± 0.5 Balm B1 44.9 ± 0.4 72.9 ± 0.4 60.2 ± 0.3 B2 52.9 ± 0.4 61.0 ± 0.4 45.9 ± 0.2 B3 53.8 ± 0.4 56.3 ± 0.4 33.4 ± 0.2 B4 50.7 ± 0.3 46.8 ± 0.4 31.9 ± 0.2 B5 68.4 ± 0.5 72.8 ± 0.4 64.2 ± 0.4 – Own preparation 58.7 ± 0.4 59.8 ± 0.4 34.2 ± 0.4
Purchased for the exclusive use of nofirst nolast (unknown)
From: SCC Media Library & Resource Center (library.scconline.org)