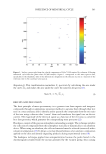
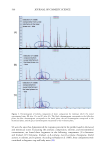
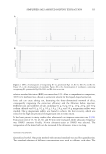
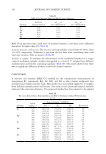
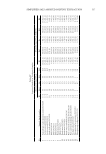
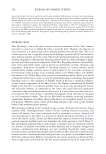
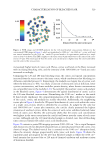
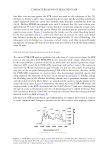
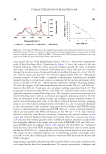
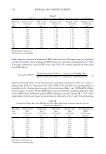
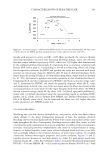
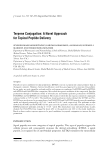
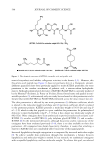
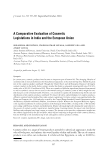
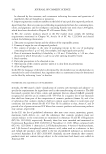
502 JOURNAL OF COSMETIC SCIENCE The treated area was sealed with a glass apparatus to collect volatiles on the experimental times (t 0 , t 1h30 , t 3h , t 4h30 and t 6h ). The volatiles were collected in a glass tube packed with a porous polymer resin based on 2.6-diphenylene oxide (Tenax®) using the dynamic headspace collection technique. After collection, the Tenax® tubes were coupled to a thermal desorption apparatus (ATD 650® Turbo Matrix [PerkinElmer, Waltham, MA]), desorbed at 100°C for 10 min with a helium flow of 60 mL/min and injected in the GC/MS equipment (Agilent model 6890/ Mass Spectrometer 5973). The chromatographic conditions were: • Temperature trap −30°C during the concentration, valve maintained at 150°C. • During the desorption step of the trap, the trap temperature increased to 225°C with a helium flow at 1.5 mL/min. • Injection split ratio 5:1 (total sample injected = 16.7%) interface temperature of 280°C. • Volatiles were transferred to a capillary column HP Ultra 2, 50 m x 0.20 mm i.d. x 0.33- μm film thickness. • Temperature gradient: 50°C/2 min for stabilization followed by a temperature increase of 3°C/min until 280°C. • Carrier gas: helium at a flow rate of 1.5 mL/min. • Mass spectra were registered after the column with an interface at 280°C and ion source temperature of 250°C. • The ionization potential was adjusted to 70 eV and ions monitored with a range of 35–350 mass-charge (m/z). We identified the compound by comparing retention indexes (Kóvats Index—determined relative to the retention times of a series of n-alkanes) and mass spectra with literature data (5,19,20). MULTIVARIATE ANALYSIS OF CHROMATOGRAPHIC DATA The methodology applied in this experiment was adapted from a study previously described by Pavon et al. (2006) for oil samples. The basic principle of mass spectrometry consists of generating ions from compounds, organic or inorganic, through an appropriate ionization method, separating them through their m/z ratio in a mass analyzer, and qualitatively and/or quantitatively detecting the compounds from the ions’ m/z ratio and their respective abundances by means of a detector. The detector “counts” the ions and transforms the signal into an electric current versus retention time. The magnitude of the electrical signal as a function of the m/z ratio is converted by a data processor, which generates the corresponding mass spectrum (21,22). The data from the mass spectra of the raw material aromatic composition, specifically abundance of the different fragments (mass-load relation or m/z) versus the retention time of the constituents, were exported in an ASCII text file. The series of data were subjected to MATLAB 6.5 software to obtain the surface contour plots of m/z versus time for each sample or aromatic composition’s raw material, as shown in Figure 1. After visual analysis of the surface contour plots, the ranges of m/z fragments selected were submitted to principal components analysis using Unscrambler software version 9.5 (CAMO Process AS, Norway, 2002) (23). Data were previously submitted to area standardization

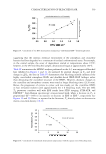
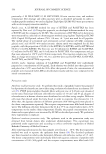
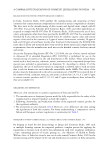
503 INFLUENCE OF MENSTRUAL CYCLE (Equation 1). This transformation normalizes X i spectrum by calculating the area under the curve Σx ij and makes the area under the curve the same for all spectra (24). New X X x i i j ij = ∑ (1) RESULTS AND DISCUSSION The basic principle of mass spectrometry is to generate ions from organic and inorganic compounds through an appropriate ionization method, to separate them through their m/z ratio in a mass analyzer, and to identify and/or quantify the compounds from the m/z ratio of the ions using a detector that “counts” them and transforms the signal into an electric current. The magnitude of the electrical signal as a function of the m/z ratio is converted by a data processor, which generates the corresponding mass spectrum (21). Headspace consists of the gaseous atmosphere surrounding a sample. The technique involves the collection of compounds from this atmosphere statically or dynamically to an adsorbent device. When using an adsorbent, the collected material must be released (extracted) with a solvent or temperature (25). It allows us to map the performance of an aromatic composition applied on the skin and identify degrading products during experimental times (18). The headspace technique applied was semiquantitative because the peaks found in the chromatograms resulted from the suction generated by the vacuum pump, thus causing Figure 1. Surface contour plot from the volatile components of Ciclo® 1910 emitted by volunteer 19 during menstrual cycle follicular phase after GC/MS analysis. Figure 1 corresponds to the mass spectra data, specifically to the abundance data of the different m/z fragments in the abscissa axis (x) as a function of the retention time in the coordinate axis (scan-y).
Purchased for the exclusive use of nofirst nolast (unknown)
From: SCC Media Library & Resource Center (library.scconline.org)