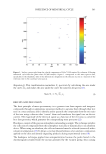
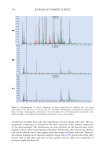
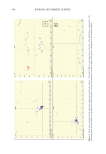
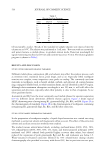
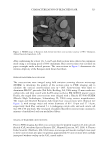
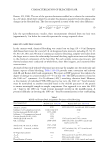
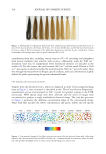
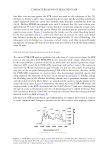
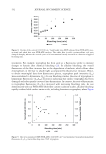
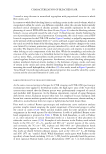
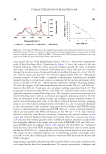
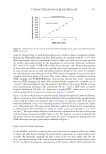
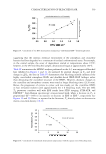
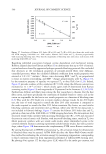
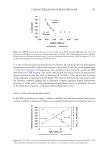
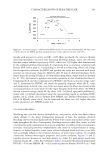
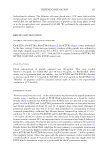
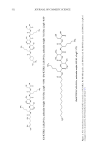
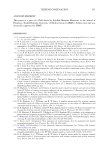
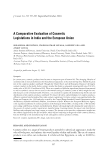
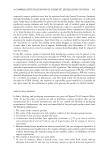
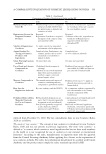
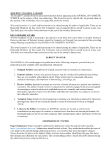
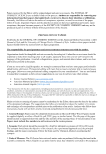
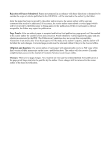
528 JOURNAL OF COSMETIC SCIENCE contributions from hair, including various sources of C—O stretching and phosphates from nuclear remnants, may interfere with accuracy additionally, using the 1080 cm−1 absorption band may be inappropriate when formulated additives are included in the studies (20). For this reason, the ratio between 1040 cm−1 and the amide II band at 1548 cm−1 was used as an alternate method for normalizing the 1040 cm−1 spectral marker. Note that the applied measurement technique, specific analyses, and local conformations slightly shifted the peaks representing the protein vibrational bands. FTIR IMAGING OF HAIR CROSS-SECTIONS Samples from the bleached tresses, which are displayed in order of increasing bleaching time in Figure 2, were sectioned as described in the “Hair Cross-Section Preparation” experimental section and arranged on CaF 2 crystals for optimal staging in the FTIR microscope. FTIR spatial maps were then collected, and the series of images were concatenated to produce a single standardized chemical image. The color bar spectrum in Figure 3 represents the sulfonate concentration range in the concatenated image, where dark blue specifies the lowest concentration, and green, yellow, and red specify Figure 2. Photograph of (1) European dark brown hair, and European dark brown hair bleached for (2) 15 min, (3) 30 min, (4) 45 min, (5) 60 min, (6) 90 min, (7) 120 min, (8) 180 min, and (9) 240 min. For the series of tresses, a plot of ΔE as a function of the kynurenine fluorescence intensity (I440/I339) resulted in a linear relationship of increasing slope with very good correlation (R2=0.91). Figure 3. Concatenated images of hair fiber cross-sections treated for the indicated times with a bleaching formula. The color bar denotes the mid-IR 1040/1080 cm−1 normalized band area intensity, where the dark- red color specifies the highest level of cysteic acid in the 2D image of a cross-section.

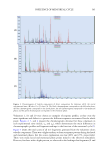
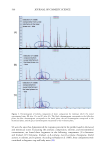
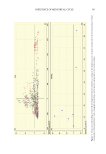
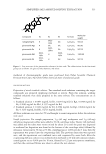
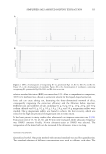
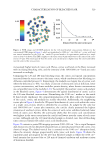
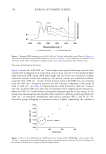
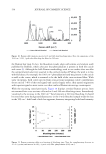
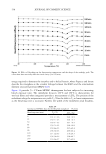
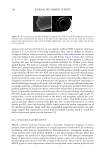
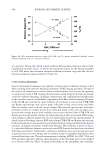
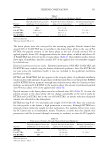
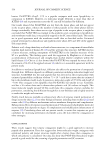
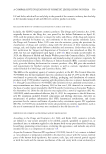
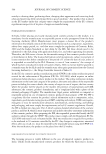
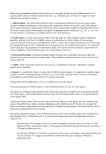
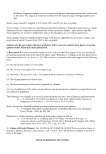
529 CHARACTERIZATION OF BLEACHED HAIR increasingly higher levels of cysteic acid. Hence, cysteic acid levels in the fibers increased with increasing bleaching time, and the intensity of the 1040/1080 cm−1 band area ratio increased accordingly. Comparing the 120 and 180 min bleaching steps, the cysteic acid spatial concentration increased from the outer cortex to the inner cortex, which corroborates that bleaching is a diffusion-controlled process (1). Interestingly, the medulla was largely free of cysteic acid, where the deficiency in -SO 3 − was likely a function of obstructed cortical diffusion, lower cystine concentrations, and lower medullar protein density, where keratin concentrations are comparably lower in the medulla (1,21). To exemplify the resultant cysteic acid gradient in the bleached cortex, Figure 4 demonstrates the spatial distribution of cysteic acid in the 120 min bleached cross-sections. Normalizing the 1040 cm−1 marker to the amide II band clearly emphasizes the compartmentalization of the fiber, where the boundaries of the cuticle, cortex, and medulla are readily observable. Additionally, the neighboring scatter plot in Figure 4 details the 1D spatial distribution of cysteic acid within the cortex of a single cross-section, which is identified by an asterisk. As judged by the color bar and 1040/1548 cm−1 scatter plot intensities, the cuticles clearly presented the highest intensities of oxidized cystine, while the centers of each cortex exhibited relatively lower levels of cysteic acid. Further, the scatter plot shows that the cysteic acid concentration was highest in the outer cortex (near the cuticle) and lowest near the center of each cross- section. Although only the 120 min bleached sample is detailed, note that all bleaching times conveyed similar 1D radial cysteic acid distributions. Figure 5A contains a partial IR imaging spectrum (1900–900 cm−1) for a virgin European dark brown tress (0 min bleached) obtained from an individual pixel from the cortex of its chemical image. The dashed vertical line is centered on the 1040 cm−1 absorption band, where the intensity changes proportionally with cysteic acid levels. Figure 5B shows the equivalent pixel spectrogram for the 240 min bleached sample in which the 1040 cm−1 band intensity has increased due to 240 min of chemical oxidation and resultant scission of keratinous disulfide. Figure 4. FTIR image and 1D EDF gradient for the 120 min bleached cross-sections. Relative to the concatenated FTIR image in Figure 3, which was normalized to 1080 cm−1, the 1040 cm−1 cysteic acid band was instead normalized to the 1548 cm−1 amide II spectral marker. A representative gradient for a single cross-section (*) is shown. The EDF is highest at the outer cortex (0 µm) and lowest at the center of the cross- section (37 µm). The results specify that the cysteic acid concentration is highest near the cuticle and lowest near the center of the cross-section.
Purchased for the exclusive use of nofirst nolast (unknown)
From: SCC Media Library & Resource Center (library.scconline.org)