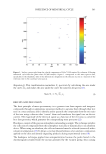
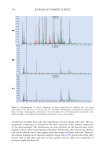
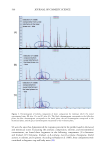
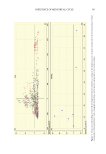
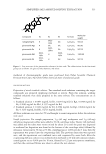
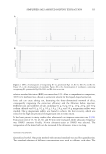
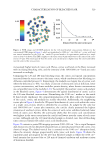
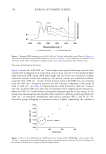
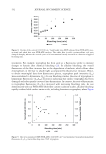
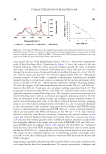
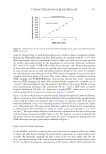
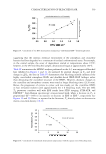
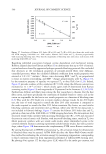
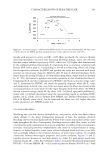
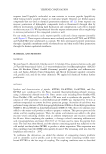
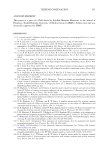
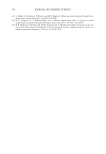
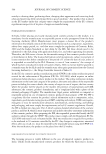
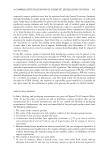
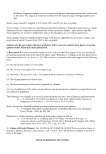
530 JOURNAL OF COSMETIC SCIENCE FTIR-ATR OF HAIR CROSS-SECTIONS Figure 6 shows the 1040/1548 cm−1 band height ratios against bleaching time for data generated by loading layers of 3-μm thick cross-sections onto the 1.5 mm diameter ZnSe single-reflection ATR crystal. Both band height and area ratios were measured, yielding equivalent analysis results. For simplicity, the protein content was normalized without using the 1071–1080 cm−1 cystine monoxide band instead, the EDF ratio was obtained from the 1040 cm−1 absorption intensity and the α-keratin component of the amide II band at 1548 cm−1 (see Table I). Substituting the amide II band for 1080 cm−1 ensured that the calculated EDF ratios were free of interference from neighboring IR absorptions, where the 1080 cm−1 band baseline is frequently infringed upon by (1) very strong -S = O absorptions emanating from the shoulder of the asymmetric sulfonate peak at approximately 1190 cm−1 (2) unwanted contributions from nuclear remnants (PO 2 − ) and (3) -C—O- functional groups belonging to extraneous sources. Lightly compressing the cylindrical Figure 5. Example FTIR imaging spectra (1900–900 cm−1) for the unbleached control (Tress 1 in Figure 1) and 240 min bleached European dark brown hair (Tress 9 in Figure 1). The dashed line is centered on the 1040 cm−1 band, which corresponds to changes in the cysteic acid concentration. AU: arbitrary units. Figure 6. Plot of the 1040/1548 cm−1 EDF band ratio obtained from FTIR-ATR cortex studies. The 1548 cm−1 component of the amide II band was chosen to normalize protein content. The encircled plateau in first 60 min was likely due to ageing of the bleaching solution.

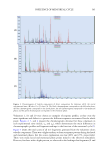
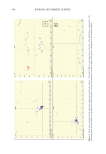
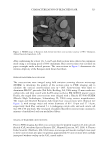
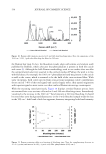
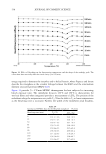
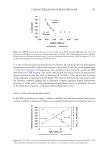
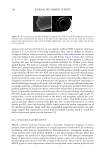
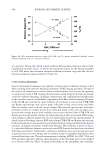
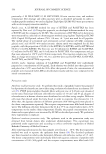
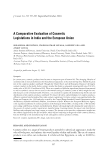
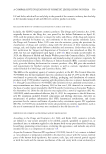
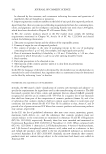
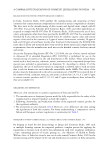
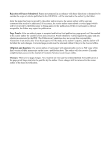
531 CHARACTERIZATION OF BLEACHED HAIR hair fiber cross-sections against the ATR crystal was used to take advantage of the 23:1 diameter-to-thickness aspect ratio, ensuring that the sections laid flat and the predominant signal originated from the cortex and medulla, with minimal contributions from the cuticle. Further, FESEM micrographs were used to estimate that the cross-sections were approximately 93.1 ± 1% (µm2/µm2) cortex, based on calculations using the average cross- sectional areas of the cortex and cuticle. Hence, the resultant spectra possessed excellent signal-to-noise ratios. Figure 6 summarizes the trends over the entire bleaching period. In the first treatment step (i.e., ≤60 min), there was an increase in cysteic acid, which was followed quickly by a short plateau after approximately 15 min of bleaching. The subsequent rate of damage (i.e., increasing cortical cysteic acid) then increased linearly through the remaining 180 min of treatment with the addition of fresh bleaching solution every 60 min. FTIR-ATR AND SPECTROFLOURESCENCE OF HAIR TRESSES To contrast FTIR-ATR analyses performed on collections of 3-µm cross-sections, the EDF ratio was also calculated from FTIR-ATR spectra measured with a single, whole hair tress. In this measurement, a portion of the uncut whole tress was pressed against the single- reflection ATR crystal. In an FTIR-ATR experiment with perfect contact, the evanescent wave from the IR source penetrates approximately 1–2 μm into the sample, meaning that only the cuticles are probed when performing FTIR-ATR on hair tresses therefore, unlike the FTIR-ATR experiment on cross-sections, this measurement provided spectra that solely represent the chemistry of the hair cuticle (see spectra in Figure 7). Further, during the bleaching process, the alkaline bleaching solution was in persistent, intimate contact with the perimeter of the fibers. Hence, we anticipated the cuticle to rapidly oxidize in the initial bleaching steps. Figure 8 summarizes the whole hair tress FTIR-ATR results and displays trends in the EDF calculated from the 1040/1548 cm−1 band ratio, showing that the rate of cysteic acid formation over the 4 h bleaching period is indeed nonlinear. Note that correlations with the 1040/1080 cm−1 band ratio obtained from hair tresses presented identical results (see EDF in Figure 8). Like hair tress ATR measurements, spectrofluorimetry of complete hair tresses is a means to study compositional changes to proteins on the fiber surface after applying cosmetic Figure 7. FTIR-ATR spectra for virgin (0 min bleached) and 240 min bleached whole-hair tresses. In previous work, the amide III (1241 cm−1) and cysteine monoxide (1080 cm−1) keratin bands had been used for cysteic acid (1040 cm−1) band normalization (16–19).
Purchased for the exclusive use of nofirst nolast (unknown)
From: SCC Media Library & Resource Center (library.scconline.org)