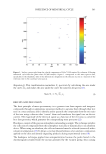
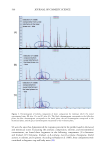
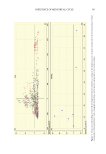
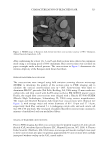
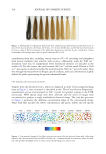
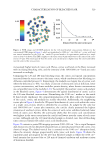
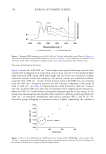
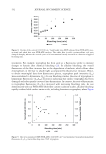
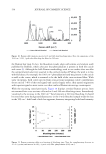
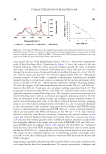
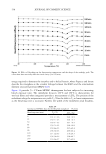
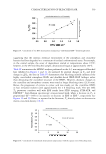
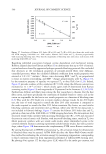
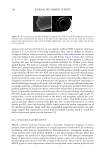
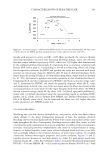
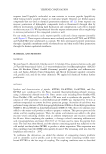
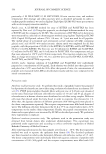
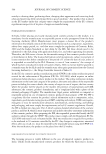
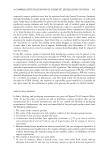
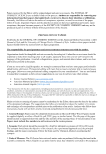
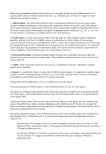
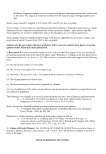
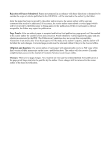
542 JOURNAL OF COSMETIC SCIENCE unique events and instead decided to use our sapphire-calibrated DSC to monitor continuous changes in C p as a function of increasing temperature. Heat capacity changes are related to changes in mobility, where increases in sample mobility at lower temperatures are connected to decreased physical and covalent matrix cross-link density. Figure 19 shows that conversion of -S—S- to -SO 3 − appears to have increased the temperature of the apparent C p inflection, meaning that ionic and hydrogen-bonded networks stabilized the dry-fiber cortex during applied heating. The peak in C p linearly correlates with increasing cysteic acid (R2=0.96), where the C p maxima ranged from 223°C for the unbleached control to 234°C for the 240 min bleached sample. Figure 19 additionally graphs the dry DSC pyrolysis enthalpy against trends in the normalized Raman 509 cm−1 band and clearly demonstrates that more thermal energy is required to vaporize matrix components with higher levels of cystine (R2=0.95). Hence, the formation of two moles cysteic acid from the scission of one mole of disulfide influences the disruption mechanism for cortical denaturation and pyrolysis. One plausible explanation is that after bleaching strongly acidic cysteic acid salts (pKa 2) rearrange and form strong ionic cross-links with basic ammonium moieties in keratin. Consequently, modified denaturation/ pyrolysis pathways are required to initiate cortical flow and pyrolysis of matrix protein (3,14). Figure 20 pictorially demonstrates the deleterious effects of excessive heating, which involved flow (left image) and the synchronous vaporization of cortical components (right image). To produce flow, scission of disulfide bonds in the matrix and interphase reduced the cross- link density and lowered the matrix viscosity to critical values. TGA-FTIR analysis of the gaseous pyrolysis effluent confirmed that flow was then activated by liberation of carbon dioxide gas (CO 2 ) from the degrading IFKPs, which pushed the molten components out of the durable microtubule. Along with other unpublished supporting micrographs, the right image suggests that vaporization occurred from the medulla outward, which is a result that had been previously reported in the literature (29). MTGA OF BLEACHED HAIR FIBER SNIPPETS MTGA combines nonlinear heating with a sinusoidal temperature program to obtain pyrolysis events and kinetic parameters in a single experiment. Furthermore, by combining modulation with dynamic high-resolution thermogravimetry, overlapping weight loss events may be more easily resolved. MTGA is a dry fibers testing technique, where hair fiber snippets are pyrolyzed at high temperatures in a 0% RH nitrogen environment. Figure 21 plots the activation energy for pyrolysis against cysteic acid concentration, where the bleaching times increase from left to right on the abscissa. Next to the E a data are the MTGA pyrolysis onset temperatures, where the extrapolated onsets correlate positively and Figure 20. View of the cortex of a bleached fiber at temperatures 250°C. In the left image, note the cortical remnants that extruded from the interior of the fiber. In the right image, observe the reduction in cortical material and the persistence of the cuticle. At higher temperatures, the cortex was torn asunder and only the cuticle remained.

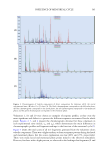
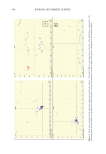
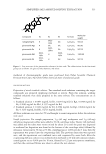
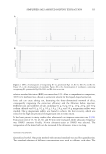
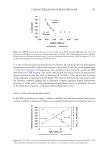
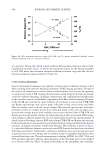
543 CHARACTERIZATION OF BLEACHED HAIR linearly with increases in cysteic acid (R2=0.95). More specifically, the onsets to thermal denaturation/pyrolysis increased with increasing bleaching damage, where the 240 min bleached sample exhibited pyrolysis at 248°C, which was 11°C higher than demonstrated by the nonbleached fibers. Interestingly, E a magnitudes show a curvilinear correlation with Raman EDF, with a peak E a corresponding to 60–90 min bleaching. Hence, the energy barrier required to denature the IFKPs and pyrolyze the cortex was increased with minor increases in cortical ionic character. However, after 90 min of chemical bleaching, the E a barrier began decreasing. Finally, at 240 min of bleaching, where cystine bonds are lessened by 40−50%, the barrier to pyrolysis was nearly equivalent to that of unbleached hair (1). Comparing the E a and onset temperatures by MTGA to the Ozawa activation energy values and T D determined by HPDSC, the trends are generally disparate, where the E a values and temperatures to break ionic cross-links were lower when the fibers were heated under increasing pressure in excess water. For the virgin European dark brown fibers, the MTGA derived activation energy values for dry fibers (358 ± 6 kJ/mol) agree with published E a results (416 ± 8 kJ/mol) determined using the non-reversing signal in modulated DSC further, our E a results (251 ± 7 kJ/mol) from HPDSC also followed Wortmann’s results (263 ± 16 kJ/mol), where the E a for the untreated dry fibers was 43% higher than the results obtained in wet HPDSC studies (14). DVS OF BLEACHED FIBERS Modifying the cross-link density, hydrophilicity, and porosity of the hair fibers induces subtle changes to the water management properties of hair. For example, chemical bleaching cleaves structural lipids from the F-layer of the cuticle and oxidizes cystine cross- links throughout the fiber. Consequently, bleaching increases whole fiber cysteic acid salt concentrations with commensurate increases in whole fiber wettability. In dry environments, secondary structuring between complementary side chains in oxidized keratin is strong however, at higher humidity, water vapor solvates hydrogen bonds and ionic cross-links and accordingly influences the temporal dynamics of water vapor sorption. To establish connections between water-regain properties and cystine oxidation, Figures 15 and 22 together associate decreases in cross-link density (i.e., lower T D ) with greater steady-state moisture regains (R2=0.94). For convenience, Figure 22 includes the inversely proportional DVS (R2=0.94) and HPDSC (R2=0.92) results against the Raman 509/1003 cm−1 band Figure 21. Activation energy (± 8 kJ/mol) from MTGA studies as a function of Raman EDF. The values next to the Ea data are the MTGA pyrolysis extrapolated onset values, which are in units of ± 0.5°C.
Purchased for the exclusive use of nofirst nolast (unknown)
From: SCC Media Library & Resource Center (library.scconline.org)