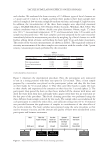
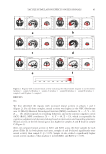
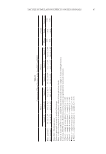
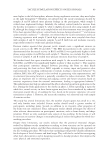
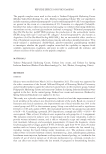
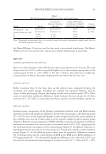
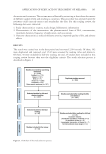
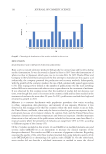
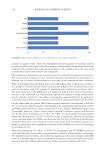
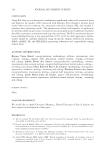
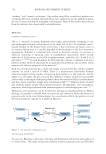
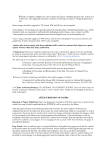
83 Tactile Stimulation Effects on EEG Signals and colorless. We evaluated the foam viscosity of 12 different types of facial cleansers on a 7-point scale (0 =low to 6 =high), and from these products three foam samples were selected: sample A: low viscosity sample B: medium viscosity and sample C: high viscosity. In addition, the viscoelasticities of the three foam samples were objectively measured using a HAAKE RheoStress 600 (Thermo Fisher Scientific, Waltham, MA, USA). The analysis conditions were as follows: double cone plate (diameter: 60mm angle: 1°) shear rate: 100 s−1 measurement temperature: 25 °C and measurement time: 120 seconds each sample was measured twice. The foam samples used were prepared by the same researcher immediately before the measurement procedure by weighing 2g of facial cleanser in a milk frother, adding 24mL of water, and frothing the foam with 50 up-and-down movements. The results of the viscosity measurements are shown in Table I. The magnitude relation of viscosity measurements of the three samples was consistent with the results of the 7-point sensory evaluations previously performed by the researcher. EXPERIMENTAL PROCEDURE Figure 1 illustrates the experimental procedure. First, the participants were instructed to rest in a sitting position with their eyes open for 120 seconds. Then, a foam sample prepared by a researcher was placed on the participants’ palms and they felt the foam on their hands for 30 seconds (phase 1). They then used their hands to apply the foam to their cheeks and experienced the sensation on their faces for 3 seconds (phase 2). The participants then spread the foam on their faces, washed off the cleanser with water, and dried the water from their faces and hands with a paper towel there was no time limit set for this part of the procedure. This facial cleansing procedure was performed using the three different foam samples selected for this study. The sample order was randomized for each participant to control the order effect, and sufficient resting time (10 to 15 minutes) was provided between the applications of samples in consideration of the after-effect of the tactile stimulus. The foam samples were prepared using the same procedure as that used to measure viscosity, and the amount and quality of foam were standardized across participants and between treatments. Table I Viscosity of Foam Samples Viscosity (Pa·s) Sample A Sample B Sample C First measurement 0.162 0.319 0.418 Second measurement 0.181 0.328 0.412 Mean 0.172 0.324 0.415 Figure 1. Experimental protocol of the facial cleansing procedure.

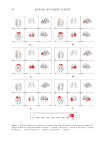
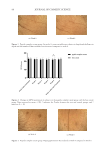
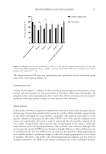
84 JOURNAL OF COSMETIC SCIENCE EEG MEASUREMENT AND ANALYSIS We measured the EEG signals during phases 1 and 2 using active electrodes (g.tec medical engineering GmbH, Schiedlberg, Austria) and a Livo bio-signal analysis system (Tec- Gihan, Kyoto, Japan) for the tests. The measurements were derived from 15 sites (Fpz, Fz, Cz, Pz, Oz, F3, F4, C3, C4, P3, P4, F7, F8, T7, T8) using both earlobes as reference electrodes, according to the international 10-20 EEG system. Data were filtered with a bandpass of 1–30 Hz, and the sampling frequency was 1,000 Hz. During the task, motor and sensory processing neural activities related to hand movement control and facial sensory input information were superimposed with additional emotional responses to the textural stimuli. We extracted EEG activities during hand movements in a period equivalent to the task execution time and when only the hand touched the face. Those activities were subtracted from the EEG activity during the task. Subtracted data (for example, EEG data capturing emotional responses) were then normalized. EEG data were analyzed using the standardized low-resolution brain electromagnetic tomography brain function imaging filter,14 and the areas and values of the neural activity (μA/mm2) were calculated. In phase 1, the 30 seconds of EEG data were separated into 3 second epochs, and the mean signal for each epoch was used. The data for phase 2 (total duration 3 seconds) were used without modification. SALIVARY CORTISOL MEASUREMENT Saliva samples were collected and the salivary cortisol levels were measured before and after the facial cleansing procedure (Figure 1). The samples were collected using the SOMA Oral Fluid Collector (SOMA Bioscience, Wallingford, UK). An oral fluid collector swab was placed on the participant’s tongue and left in place with the mouth closed. When 0.5 mL of saliva was absorbed, the swab was removed from the participant’s mouth and stored in 3 mL of buffer solution. The samples were then analyzed using a SOMA lateral flow device (LFD SOMA Bioscience, Wallingford, UK) and a SOMA cube reader (SOMA Bioscience, Wallingford, UK). STATISTICAL ANALYSIS We used the exact low-resolution brain electromagnetic tomography (eLORETA) SnPM 26 package (multiple paired t-tests with nonparametric randomization15) to investigate the neural sites activated by the foam-induced tactile stimulation during face-washing (phases 1 and 2). In the eLORETA analysis, regions of significant neural activity were colored and plotted. A two-way analysis of variance (ANOVA) was used to compare neural activities by phase (two groups) and by sample (three groups), and the salivary cortisol levels by collection time (two groups) and by sample (three groups). A one-way ANOVA with a Bonferroni post hoc analysis was used to compare the salivary cortisol changes by sample between groups. The significance level was set at 5%, and all analyses were performed using SPSS Statistics version 26.0 (IBM, Armonk, NY, USA).
Purchased for the exclusive use of nofirst nolast (unknown)
From: SCC Media Library & Resource Center (library.scconline.org)