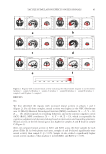
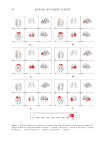
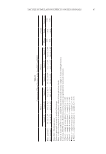
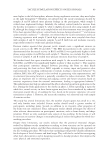
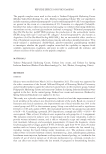
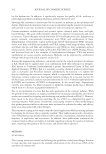
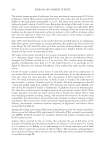
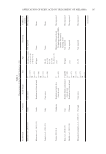
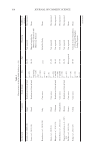
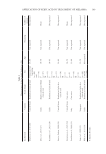
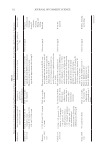
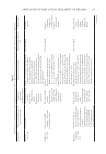
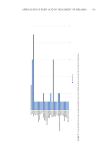
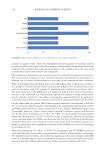
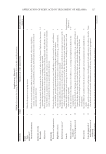
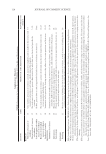
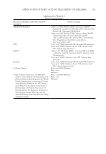
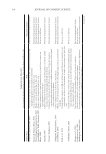
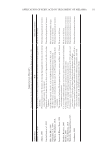
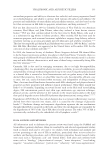
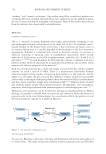
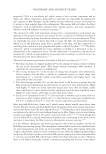
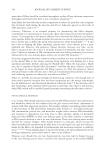
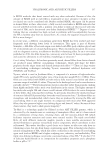
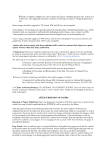
Table II Comparison of Neural Activity in the Areas BA11 and BA32 Phase 1 Phase 2 p Sample A Sample B Sample C Sample A Sample B Sample C Phase Foam Interaction BA11 (A/mm2) 46.1 ± 7.2▴ † 53.4 ± 8.2 ‡ 37.2 ± 8.1†‡ 54.5 ± 10.6•▴ 52.1 ± 6.0 ▪ 32.6 ± 7.9•▪ 0.65 0.01 0.02 BA32 (A/mm2) 38.5 ± 8.7▴ † 42.8 ± 8.5 ‡ 28.5 ± 6.1†‡ 50.4 ± 6.6•▴ 44.2 ± 6.3 ▪ 29.0 ± 5.4•▪ 0.01 0.01 0.01 Notes: BA =Brodmann area.a Values are presented as means ± standard deviations. Phase 1: effect of foam placed on hands phase 2: effect of foam placed on cheeks. Sample A: foam with low viscosity sample B: foam with medium viscosity sample C: foam with high viscosity. A two-way ANOVA with a Bonferroni post hoc analysis was performed for statistical evaluation. † Phase 1 – sample A versus phase 1 – sample C p 0.05. ‡ Phase 1 – sample B versus phase 1 – sample C p 0.05. • Phase 2 – sample A versus phase 2 – sample C p 0.05. Phase 2 – sample B versus phase 2 – sample C p 0.05. ▴ Phase 1 – sample A versus phase 2 – sample A p 0.05. 87 Tactile Stimulation Effects on EEG Signals

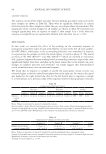
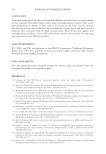
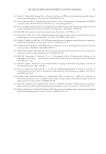
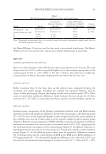
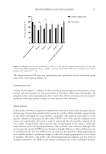
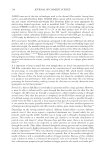
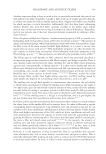
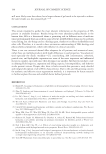
88 JOURNAL OF COSMETIC SCIENCE SALIVARY CORTISOL The salivary cortisol levels before and after the face-washing procedure using each of the three samples are shown in Table III. There were no significant differences in cortisol levels between the three samples in either the pre- or post-procedure measurements. The magnitudes of the cortisol changes for all samples are shown in Table IV. Cortisol levels changed significantly more in response to sample C than sample A (p 0.05), while the response to sample B was not significantly different from the other two (p 0.05). DISCUSSION In this study, we assessed the effect of face-washing on the emotional response of participants using three types of foam with different viscosity levels. For all foam samples, the OFC (BA11), which plays a role in rewarding behaviors, was stimulated in response to experiencing the samples on both the hands (phase 1) and face (phase 2). The neural activities of the OFC (BA11)16,17 and ACC (BA32),18,19 which are involved in motivation and cognitive judgment/decision-making based on rewarding emotions, respectively, were significantly higher than those elsewhere in the brain. Given that tactile stimuli can cause changes in cognitive processes and emotions,8 our results suggest that foam-mediated tactile stimulation may cause an emotional response. We found that in response to samples A and B, the participants’ neural activity was relatively higher in the left cerebral hemisphere than in the right one. In contrast, the signal was higher for the right frontal lobe than for the left frontal lobe in response to sample C in both phases. In a previous study, EEG responses observed during pleasant emotions Table III Comparison of Salivary Cortisol Pre-test Post-test p-value Sample A Sample B Sample C Sample A Sample B Sample C Phase Foam Interaction Salivary cortisol (nM) 6.7 ± 4.5 7.1 ± 3.9 5.0 ± 2.3 5.4 ± 2.5 6.2 ± 3.5 7.8 ± 3.9 0.88 0.89 0.21 Notes: Values are presented as means ± standard deviations. Pre-test: before a series of facial cleansing procedures post-test: after a series of facial cleansing procedures. Sample A: foam with low viscosity sample B: foam with medium viscosity sample C: foam with high viscosity. A two-way ANOVA with a Bonferroni post hoc analysis was performed for statistical evaluation. Table IV Comparison of Changes in Salivary Cortisol Sample A Sample B Sample C p-value Magnitude of salivary cortisol change (nM) −1.35 ± 3.3 (−6.7 to 2.3) −0.9 ± 3.6 (−4.8 to 5.7) 2.7 ± 2.4 (−0.5 to 6.5)† 0.03 Notes: Values are presented as means ± standard deviations (minimum value−maximum value). Sample A: foam with low viscosity sample B: foam with medium viscosity sample C: foam with high viscosity. Magnitude of change =post-test value minus pre-test value. †Sample A versus sample C p 0.05.
Purchased for the exclusive use of nofirst nolast (unknown)
From: SCC Media Library & Resource Center (library.scconline.org)