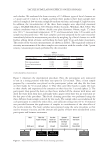
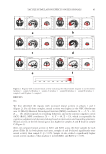
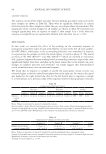
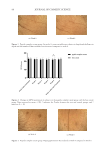
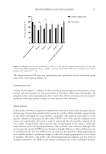
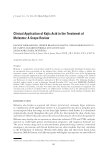
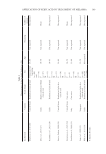
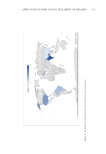
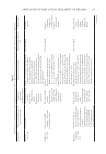
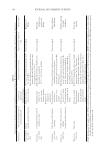
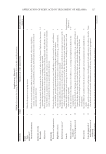
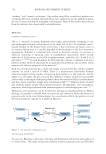
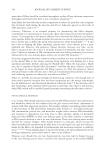
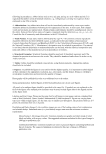
86 JOURNAL OF COSMETIC SCIENCE Figure 3. Regions with increased neural activity representing the different emotional responses triggered by reward differences in the foam samples: (a) phase 1 – sample A (b) phase 2 – sample A (c) phase 1 – sample B (d) phase 2 – sample B (e) phase 1 – sample C and (f) phase 2 – sample C.

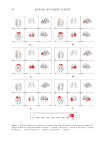
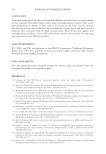
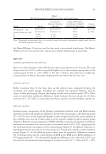
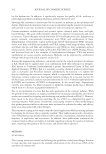
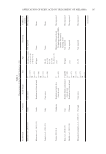
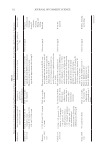
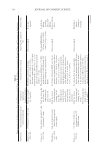
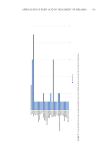
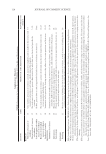
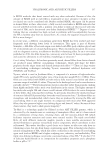
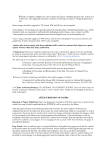
Table II Comparison of Neural Activity in the Areas BA11 and BA32 Phase 1 Phase 2 p Sample A Sample B Sample C Sample A Sample B Sample C Phase Foam Interaction BA11 (A/mm2) 46.1 ± 7.2▴ † 53.4 ± 8.2 ‡ 37.2 ± 8.1†‡ 54.5 ± 10.6•▴ 52.1 ± 6.0 ▪ 32.6 ± 7.9•▪ 0.65 0.01 0.02 BA32 (A/mm2) 38.5 ± 8.7▴ † 42.8 ± 8.5 ‡ 28.5 ± 6.1†‡ 50.4 ± 6.6•▴ 44.2 ± 6.3 ▪ 29.0 ± 5.4•▪ 0.01 0.01 0.01 Notes: BA =Brodmann area.a Values are presented as means ± standard deviations. Phase 1: effect of foam placed on hands phase 2: effect of foam placed on cheeks. Sample A: foam with low viscosity sample B: foam with medium viscosity sample C: foam with high viscosity. A two-way ANOVA with a Bonferroni post hoc analysis was performed for statistical evaluation. † Phase 1 – sample A versus phase 1 – sample C p 0.05. ‡ Phase 1 – sample B versus phase 1 – sample C p 0.05. • Phase 2 – sample A versus phase 2 – sample C p 0.05. Phase 2 – sample B versus phase 2 – sample C p 0.05. ▴ Phase 1 – sample A versus phase 2 – sample A p 0.05. 87 Tactile Stimulation Effects on EEG Signals
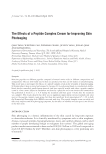
Purchased for the exclusive use of nofirst nolast (unknown)
From: SCC Media Library & Resource Center (library.scconline.org)