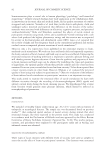
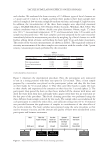
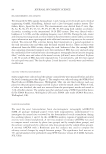
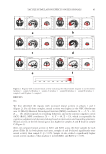
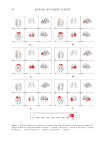
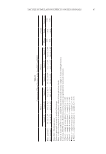
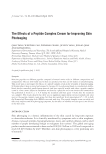
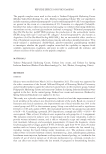
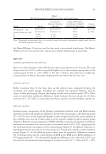
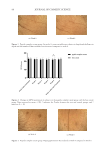
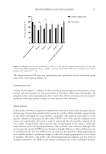
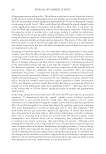
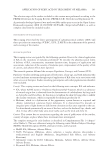
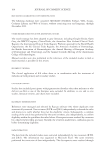
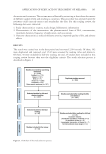
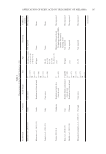
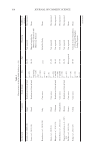
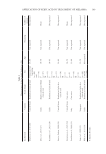
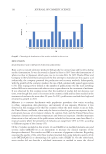
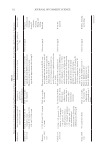
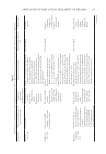
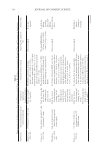
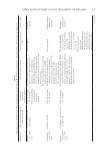
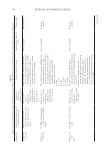
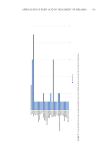
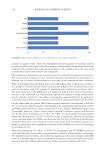
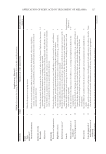
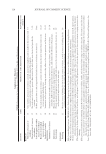
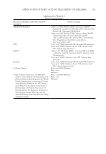
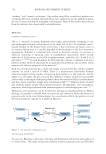
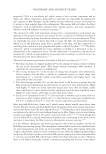
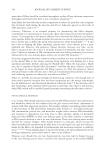
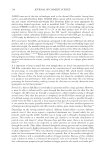
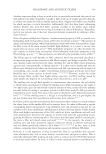
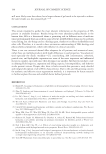
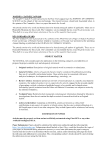
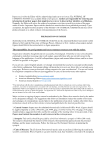
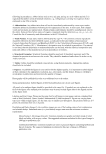
95 Peptide Effects on Photoaging the Mann-Whitney U test was used for data with a non-normal distribution. The Mann- Whitney U test was used for the comparisons between both groups of grade data. RESULTS GENERAL INFORMATION AND ANALYSIS Data were collected from a total of 80 female subjects aged between 45–55 years. The total dropout rate was 6.25%, with a marginally higher rate in the treatment group than in the control group (10.0% vs. 2.5%, Table 1). For the 5 subjects who were lost to follow-up, missing values in efficacy data were imputed with outcomes from the last visit. BASELINE ANALYSIS Before treatment (day 0), the basic data on the subjects were compared between the treatment and control groups, including age, outdoor sun exposure duration, and the degree of skin photoaging (Glogau photoaging classification standard (grade I-IV)). There were no statistically significant differences found between the two groups for all three indicators (P .05, Table 1), indicating that efficacy analysis could be properly carried out. EFFICACY ANALYSIS Between-group comparisons of the Chung’s standardized wrinkle scale and RGB wrinkle showed no statistically significant differences between the two groups at all follow-up points (P .05). Decrease in the length and depth of coarse wrinkles and decline in the number of fine wrinkles were noticed in some subjects of the peptide complex cream treatment group (Figure 1). Between-group comparison of DPAS identified a statistically significant difference between the treatment and control groups at treatment week 8 (P=.047), suggesting that the treatment group was superior to the control group (Figure 2). In addition, reduction in hyperpigmentation was noticed in some subjects of the peptide complex cream treatment group (Figure 3). At all follow-up points, there were no significant differences between the treatment group and the control group in RGB spots, RGB pores, RGB roughness, or UV pigmentation (P .05). Statistically significant differences were observed in UV acne between the treatment and control groups at treatment weeks 2 (P=.046) and 4 (P=.027). Table I Baseline Characteristics of Subjects in Test and Control Groups Group Age (y) Outdoor Sun Exposure Duration (min/day) Glogau Photoaging Classification Standard Grade I–IV (rank mean) dropout rate (n,%) Test group (n =40) 48.00 (3.75) 40.00 (18.75) 40.50 4(10.0%) Control Group (n =40) 49.50 (4.75) 45.00 (23.75) 40.50 1(2.5%) Z –1.800 –1.410 0.000 P 0.072 0.159 1.000 Note: Nonnormal measurement data are described using the median (interquartile range) grade data are described using the rank mean.

96 JOURNAL OF COSMETIC SCIENCE (a) Week 0 (c) Week 8 Figure 1. Peptide complex cream group. At weeks 8, coarse wrinkles were shorter in length and shallower in depth and the number of fine wrinkles were decreased compared to week 0. Figure 2. Changes in DPAS parameters in subjects in the peptide complex cream group and the base cream group. Data expressed as mean ± SD *indicates the P-value between the test and control groups, and *indicates P .05. (a) Week 0 (c) Week 8 Figure 3. Peptide complex cream group. Hyperpigmentation was reduced at week 8 compared to week 0.
Purchased for the exclusive use of nofirst nolast (unknown)
From: SCC Media Library & Resource Center (library.scconline.org)