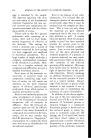
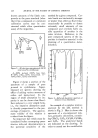
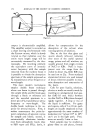
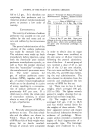
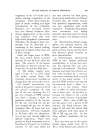
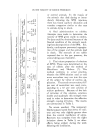
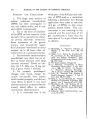
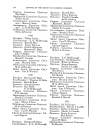
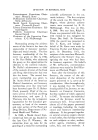
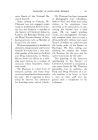
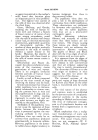
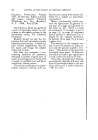
INFRA-RED SPECTROSCOPY AND ITS APPLICATION 269 of the major component, chloroform, this spectrum was obtained in a double-beam spectrometer (to be mentioned later) with pure chloro- form in the reference beam. From the calibration data it was noted that the I.R. method would be less suitable for C•.C16 than for C•.C14, for example, where as little as 0.01% would be easily detectable. The optical layout of a simple infra- red spectrometer (the Perkin-Elmer Model 12) is shown in Fig. 6. The source of I.R. light is an electrically heated rod of silicon carbide (called a globar) which emits a continuous spectrum with a maximum at about 2.5•. The polychromatic light beam is focused on the entrance slit of the spectrometer after passing through Com- pound ,•CH2C12---- Mix- ture % Diff. 1 2.07 +0.27 2 3.94 +0.10 3 7.58 --0.58 4 6.78 --0.39 5 4.43 +0.10 6 7 3'. •5'1 +b'.'14 8 2.37 +0.23 9 5.47 --0.06 10 6.86 +0.15 Av. 4- 0.22 Av. % error 4- . 46 •$-C2C14H.• % Diff. 1.28 +0.19 4.50 +0.18 6.74 +0.12 4.59 --0.25 6.26 --0.29 2.51 +0.67 3.29 --0.12 6.09 -0.36 4.40 +0.07 2.04 +0.25 4-0.25 4- .60 - C•C16----- - C2C14 ,•C2ClaH• % Diff. % Diff. % Diff. 0.76 +0.27 ...... 1.49 +0.09 1.24 +0.17 2.10 +0.28 1.08 --0.1S 0'.}•) +•)'.'10 1.57 +0.09 2.24 --0.09 0.53 +0.02 1.33 +0.03 2.56 +0.74 0.59 +0.02 1.01 +0.24 1.96 --0.24 0.83 --0.09 3.31 --0.59 3.15 --0.85 3.42 --0.32 2.99 --0.25 1'.5'1 --b'.'11 0.95 --0.02 1.94 +0.19 0.59 +0.01 0.95 +0.04 0.97 +0.45 0.50 +0.03 1.40 +0.21 4- 0.34 4-0.05 q- 0.19 4-18.0 4- .72 +10.8 Figure 4.--Summary of Infra-red Analyses. Figure 4 shows a table of analyti- cal results for several synthetic mixtures of these compounds in chloroform. The average deviation was about 4-0.3 mole % for each of the impurities. The literature con- tains many other examples of the quantitative analysis of complex mixtures, including mixtures of iso- mers whose composition is very difficult to determine by any other method. Thus we may summarize (in Fig. 5) the broad applications of I.R. spectra to practical chemical prob- lems. Next we will briefly discuss some of the more important instrumental details of infra-red spectroscopy. Applications of I.R. Spectra 1. Establishment of identity or non- identity of different samples. 2. Control of quality of process materials and products. 3. Determination of functional groups in unknown samples. 4. Identification of pure compounds. 5. Qualitative analysis of mixtures. 6. Quantitative analysis of mixtures. Figure 5. the sample (not shown in the dia- gram). The light is then dispersed by a prism, reflected back along its path by the plane Littrow mirror M4, to a small diagonally placed mirror M5 which directs the radia- tion out through the exit slit &. The small, nearly monochromatic band of radiation leaving & is focused on a thermocouple T whose

270 JOURNAL OF THE SOCIETY OF COSMETIC CHEMISTS :: I FT output is electronically amplified. The amplifier output is recorded on a chart moving synchronously with the Littrow mirror, which is slowly rotated so that radiation over the entire wave length range will be successively measured by the ther- mocouple. By recording similarly the equivalent curve of intensity versus frequency with the sample removed from the incident beam it is possible to obtain the absorption spectrum of the sample expressed as % transmittance versus frequency or wave-length. The more modern instruments employ double beam technique where one beam is passed through the sample while another beam goes through a blank or reference cell and the recorded spectrum is a direct plot of % transmittance versus frequency or wave-length. The double beam technique is far su- perior for several reasons. First, it makes unnecessary the point-by- point comparison of separate curves for sample and blank second, it automatically eliminates interfer- ence from atmospheric bands (due to H=O vapor and COs) lastly, it allows for compensation for the absorption of the solvent when running spectra of solutions. Due to the fact that glass and " 1 quartz absorb infra-red radiation over most of the useful spectral range, prisms and cell windows are usually ground from single crystals of NaC1 or KBr. NaC1 is trans- parent over the range from the visible to about 15u, while KBr may be used out to 25u. Front-surfaced aluminized mirrors are used instead of lenses wherever possible to mini- mize absorption and attenuation of the beam. Cells for pure liquids, solutions, slurries or mulls are usually made by inserting an amalgamated lead gas- ket (0.02-0.1 min. thick) between two flat NaC1 or KBr plates clamped rigidly together. A drop or two of the liquid is sufficient. For gases and vapors, cells of 5 or 10 cm. path length are usually employed so that approximately the same number of ! molecules/cm. 2 (about l018 to 10•ø/ cm. •') are in the light path. Pres- sures are usually 1 arm. or less. Solid samples may be studied as glassy films on salt plates, formed
Purchased for the exclusive use of nofirst nolast (unknown)
From: SCC Media Library & Resource Center (library.scconline.org)