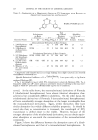
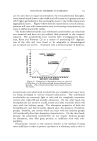
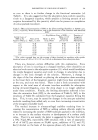
PARAMETERS OF EMULSION STABILITY 241 as soon as there is no further change in the fractional saturation (cf. Table I). It is also suggestive that the adsorption data conform quantita- tively to a Langmuir equation, which predicts a limiting amount of ad- sorption determined by the quantity which can be present on completion of a close-packed monolayer. Table l--Effect of Concentration of SDS on the Ultracentrifugal Stability at 39,460 r.p.m. of 50% Nujol-50% Water Emulsions, and on the Saturation of the Interface with Adsorbed SDS* ,----Equilibrium Conc. of SDS , Fraction of Initial Conc. of Moles X 106 Langmuir SDS in the Rate of Oil Moles X 10¾1. Adsorbed Saturation Aqueous Phase, % Sepn., %/min. in aq. Phase per mi. Oil Adsorption 0.2 0.51 2.89 4.08 0.65 0.3 0.31 5.66 4.76 0.75 0.35 0.28 6.59 5.57 0.86 0.4 0.16 8.15 5.74 0.91 0.45 0.16 9.66 5.97 0.93 0.5 0.14 11.76 5.61 0.89 0.6 0.14 ......... * The values reported here are the average of data obtained on emulsions with specific interfacial areas of 1.85 to 1.92 X 104 cm.2/ml. oil as determined from adsorption data. There are, however, certain difficulties with this explanation. Since adsorption of ions is occurring at a charged interface, there should be an electrical work term in the adsorption equation (15) which would invalidate the simple Langmuir equation and result in changes in adsorption due to changes in the ionic strength of the solution. Moreover, a change in the slope of the line obtained on plotting the adsorption data according to the linear form of the Langmuir equation might have been anticipated at the cmc, and none was found. There is also a little uncertainty with respect to the total area of oil-water interface available for adsorption during ultracentrifugation, since the drop shape is no longer spherical under these conditions. Finally, the limiting adsorption achieved is less than the saturation limit (90% in the emulsions of Table I 86% in the emulsions of Table II) calculated from the Langmuir equation fitting the data. This, in turn, may be caused by changes in the area per adsorbed molecule resulting from added salt, or even from increasing concentration of the ionogenic emulsifier itself. The marked increase in ultracentrifugal stability resulting from in- creasing the concentration of SDS or adding sodium chloride might be related to increasing the number of SDS molecules packed in the interface, or to increase in the surface viscosity or development of a surface yield value. That it is not merely the latter is suggested by the fact that with a 50% Nujol-50% water-0.2% SDS emulsion with a rate of separation of oil of 0.47% per minute at 39,460 r.p.m., additions of 1% and 5% lauryl alcohol on the basis of the aqueous phase only decreased the rate

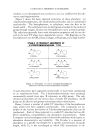
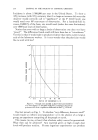
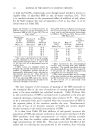
242 JOURNAL OF THE SOCIETY OF COSMETIC CHEMISTS to 0.42 and 0.43%, respectively, even though lauryl alcohol is known to rigidify films of adsorbed SDS at the air-water interface (16). This is in marked contrast to the pronounced effect of addition of salt, where 0.1 M NaC1 reduces the rate of separation of oil to less than 1/5 of its initial value (cf. Table III). TABLE II--ErrECT or CONCENTRATION OF SDS ON COVERAGE OF THE INTERFACE WITH ADSORBED SDS IN 50% NUJOL-50% WATER EMULSIONS* Initial Conc. Area, of SDS Fraction of Available• in the Langmuir per Aqueous Saturation Adsorbed Phase, % Adsorption SDS in •2 TABLE Ill--EFFECT OF SODIUM CHLORIDE ON THE ULTRACENTRIFUGAL STABILITY AT 39,460 r.p.m. AND ON THE INTEntrACIAL ADSORPTION or SDS IN 50% NUjOL-50% WATER--0.2% SDS EMULSIONS Are a Availabler Conc. of Rate of* per NaC1, Oil Sepn., Adsorbed Moles/Liter %/min. SDS in/i,2 0.20 0.64 78.8 0.30 0.74 66.9 0.0 0.51 78.9 0.35 0.80 62.9 0.005 0.36 71.0 0.40 0.86 58.7 0.01 0.28 68.8 0.45 0.85 58.9 0.02 0.23 0.03 6'3'.'1 * The values reported here are the average 0.05 01 i • 60.6 of data obtained on four or five emulsions 0.1 0.095 57.4 with specific interfacial areas of 1.81 to 2.07 X 104 cm.2/ml. oil as determined from ad- sorption data. t These values are obtained simply by dividing the specific interfacial area by the product of Avogadro's number and the ex- perimentally determined moles adsorbed at the interface per ml. oil. They will all be changed by a constant factor if the value of 50 A2 per adsorbed SDS used in the calcula- tion of specific interfacial area should ever be revised in the light of new data. * Data reported for the ultracentrifugal stability were obtained with three different emulsions. The specific interfacial area was only determined for one, the value being 1.81 •' 104 cm.2/ml. oil. The others probably had comparable but not identical areas. • The values reported here are the average of the data obtained on three emulsions with specific interfacial areas of 1.96, 1.94 and 1.81 X 104 cm.¾ml. oil as determined from adsorption data. The best measure of the closeness of packing of the SDS molecules in the interfacial film in the case of emulsions of varying specific interfacial areas is the area available per adsorbed molecule. Table II shows that as the concentration of SDS is increased more is adsorbed so the area per molecule decreases, reaching a limiting value of about 59 •2. This seems to be a saturation limit and is reached when the concentration of SDS in the aqueous phase of the emulsion reaches the cmc. Simultaneously the rate of loss of oil becomes constant at 0.14% per minute despite further increases in the initial concentration of SDS. It is clear from Table III that addition of salt greatly increases the adsorption of SDS, the area per molecule at the oil-water interface in 0.2% SDS emulsions with high concentrations of sodium chloride actually being less than the smallest values attainable with SDS alone even at high concentrations (cf. Table II). This may result from the effect of the added salt on reducing the zeta potential at the interface, thus reducing
Purchased for the exclusive use of nofirst nolast (unknown)
From: SCC Media Library & Resource Center (library.scconline.org)