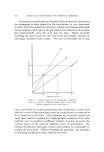
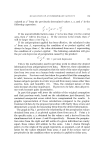
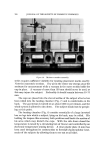
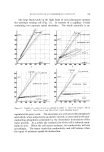
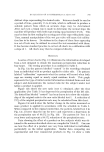
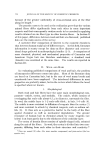
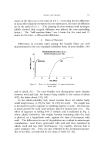
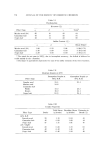
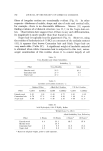
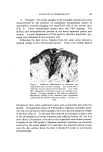
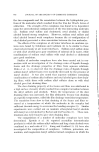
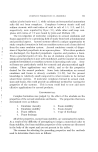
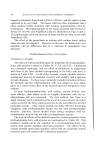
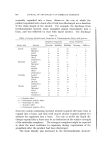
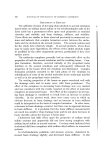
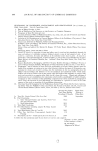
752 JOURNAL OF THE SOCIETY OF COSMETIC CHEMISTS obtained from area A and y is the value from area B. This test is done once with no product applied to either area. The ratio itself becomes the control. In a second test an antiperspirant material is applied to area A, leaving area B untreated. If the material is effective, a lower perspira- tion rate will be obtained from area A, to which a new value x' is as- iii/ I IIIII / 11 / •/•ontro, / // X •'• Values for Area A Figure $. Practical plot of the output of perspiration from area A & B under control and test conditions. The dotted lines rep- resent the corrected test lines for a valid comparison signed. The output from area B may increase or decrease, but rarely will it be the same as that of the first test, because of the influence of the uncontrollable variables. The value y' is assigned to it. The result of the second test is a new ratio of perspiration from the two areas for the condition where a product is applied to one side only. It is expressed as x'/y'. However, x' includes both the effects of the product and those of the uncontrollable factors which caused y to change to y'. Thus the following inequality results: x ! 0c y•y A new value of x from area A, which does not include the effects of the product when y' is the value for area B, is now required. It may be cal-

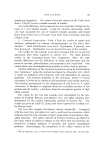
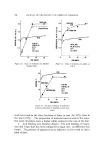
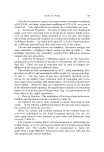
EVALUATION OF ANTIPERSPIRANT ACTIVITY 753 culated as x" from the previously determined values x, y, and y' in the following expression: -- =-orx" - (1) If the uncontrollable factors cause y' to be less than y in the control area, then x" will be less than x. If the converse is the result, then x" will be larger than x (see Fig. 1). If the antiperspirant applied has been effective, the calculated value x" from area A, representing the condition of no product applied, will always be larger than x', the value determined from area A representing the condition of a product applied. The following calculation will give the per cent depression of perspiration caused by the product: •O tt __ X t x• ß lO0 = per cent depression (2) This is the mathematics used in previous work to obtain the desired information from antiperspirant test data. However, these calculations were based on the tacit assumption that the ratio of the rates of perspira- tion from two areas on a human body remained constant at all levels of perspiration. Previous work has taken for granted that this assumption is valid however, no direct proof has yet been offered. It is known that human subjects perspire in erratic ways and from many causes other than exercise, heat, and humidity (15). Thus, the constant nature of this ratio becomes of prime importance. If proven to be false, then all previ- ous work becomes quite inconclusive. In part this paper will prove the validity of the original assumption and that previous work, based on the calculations just discussed, has contained unexpected errors which have compromised the results. A graphic representation of these calculations compared to the graphic treatment of data by the proposed procedure will clarify these errors and demonstrate a means for separating them from the desired information. The graph in Fig. 1 presents the relationship of the perspiration values obtained from area A as plotted against those from area B. Point a is the specific ratio, x/y, obtained for the values x and y derived from the simultaneous test of areas A and B respectively. Because the perspira- tion rates from the right and left axilla of a given individual are rarely equal, these values will seldom be the same. Line 1 drawn through point a to the origin of the graph represents, as assumed, a set of equal ratios for the values obtained from areas A and B for various rates of perspiration in the condition where no product is applied to either area.
Purchased for the exclusive use of nofirst nolast (unknown)
From: SCC Media Library & Resource Center (library.scconline.org)