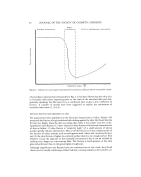
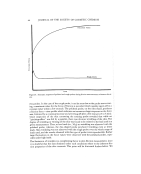
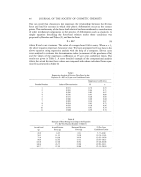
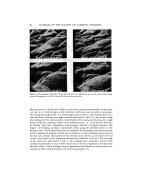
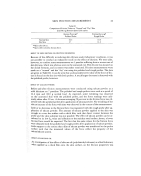
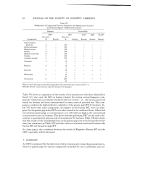
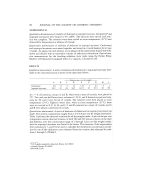
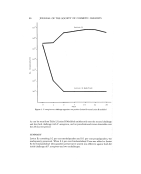
44 JOURNAL OF THE SOCIETY OF COSMETIC CHEMISTS Polished Probe Rough Probe Time Figure 4. Schematic response of polished and rough probes during friction measurements on human skin in vivo two probes. In the case of the rough probe, it can be seen that as the probe starts rotat- ing, a maximum value for the force of friction is recorded which quickly tapers off to a constant value within a few seconds. The polished probe, on the other hand, produces a friction force--time profile which indicates an instaneous large response on the force axis, followed by a continual increase and a leveling off after a few minutes (3 to 4 min). Close inspection of the skin contacting the rotating probe revealed that while no "pinching-effect" was felt by a panelist, there was obvious wrinkling of the skin. The degree of wrinkling or twisting of the skin was found to be related to the load used in a given measurement. Thus, at low loads (ca., 50 g) no wrinkling was observed with the polished probe, whereas, the disc-shaped probe produced wrinkling even at lower loads. Skin wrinkling was not observed with the rough probe over the whole range of loads used, and the results obtained with this type of probe were reproducible. Rather large fluctuations in the force values were observed with the polished probes, espe- cially under high loads. The formation of wrinkles is a complicating factor in skin friction measurement, since it is doubtful that the data obtained under such conditions relate to the inherent fric- tion properties of the skin corneum. This point will be discussed further below. We

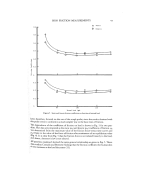
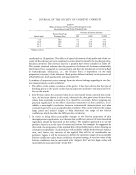
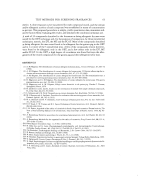
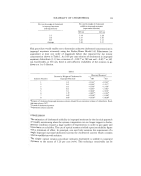
SKIN FRICTION MEASUREMENTS 45 0.6 0.5 0.4 0.3 0.2 o.z 0 0.3 0.2 0.1 Static Kinetic I , I I I I , I 50 100 150 Normal Load (gin) Figure 5. Static and kinetic friction coefficients as function of normal load '= have, therefore, focused on the use of the rough probe, since the results obtained with this probe seem to conform in a much simpler way to the basic laws of friction. :' The dependence of the coefficient of friction on load is shown in Fig. 5 for two pan- elists. The data are presented as the static (/as) and kinetic (/xu) coefficient of friction./as was determined from the maximum value of the friction force versus time curves and •k relates to the value of the force of friction after attainment of an equilibrium value (Fig. 4). It is clear from Fig. 5 that the friction force is not related linearly to the load, ß .: and, hence, Amonton's law is not obeyed. All panelists examined showed the same general relationship as given in Fig. 5. These data confirm Comafish and Bottoms' findings that the friction coefficient for human skin ::: •11 in vivo increases as the load decreases (13).
Purchased for the exclusive use of nofirst nolast (unknown)
From: SCC Media Library & Resource Center (library.scconline.org)