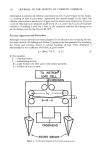
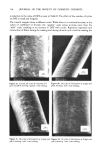
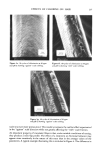
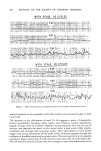
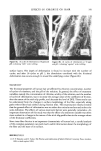
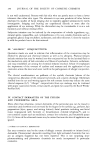
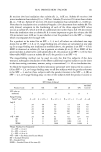
EFFECTS OF CHLORINE ON HAIR 233 An apparatus developed by Gupta (6), and used initially by Wolf (2) on sutures, adapted the twist method of measuring friction for use on the Instron © tensile tester. The device consists of a metal plate with six frictionless pulleys (Figure 2) clamped in the lower jaw of the Instron ©. The fibers are attached to the upper jaw, and twist inserted by crossing each other the desired number of times. The strands are then arranged around pulleys and fitted into grooves. Known weights are attached to fiber ends to give the value of T•. When the Instron © is started, the fiber ends in the load cell are pulled against opposing forces of friction and pretensioning weights. As this continues, tension builds up in the fibers until it overcomes the force of friction and causes slippage. The fibers hold again, then slip, producing a stick-slip profile on the Instron © recorder chart. From it the values of T 2 corresponding to the static and the kinetic frictional forces can be read and used in Equation 2 to obtain, respectively, the values of the static (its) and the kinetic (ttk) coefficients of friction. The twist angle /• is determined by measuring the horizontal (L 0 and vertical (L2) distances between the four lower pulleys and the length, D, of the twisted section of the hair fibers, the latter measured to the nearest mm on each test. The twist angle,/•, is then given by the following relation: L2 /• = 2 arctan- (3) L• -- D The value of/• for all sets of fibers tested ranged between 0.199-0.215 radians (for 2 turns of twist). The conditions selected for making measurements of friction were as follows: T• = 3 gf on each fiber n = 2 turns of twist Crosshead speed = 0.5 in/min. Chart speed = 10 in/min. Full scale load = 20 gf. All tests were performed under standard conditions (70 ø F, 65% RH) after equilibration of fibers for at least 24 hours. Values of tts and ]'•k for each pair of fibers were obtained from the Instron © charts by taking an average of 20 readings at 0.02 inch intervals after an initial run of 0.08 inch. Using new fibers for each test, measurements of friction were made both in the "with" and the "against" scale directions, five pairs of fibers being used for each configuration. The value of DFE (tq -- ttw) was calculated from the static coefficients of friction. Examination of Morphology It was of interest to examine the effect chlorination treatments produced on surface morphology of hair fibers. By examining the areas along which fibers rubbed, one could determine the extent of physical damage which resulted from small but realistic forces imposed during friction tests. This could give some idea about similar effects from operations such as combing or untangling of hair. Finally, it was of interest to determine how well the changes in morphology correlated with the changes in frictional properties. Three pairs of fibers were chosen for examination in the scanning electron microscope

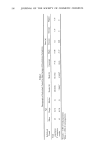
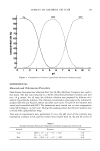
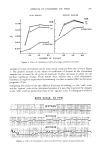
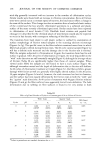
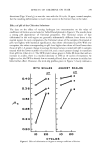
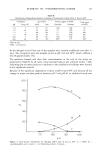
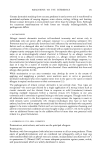
234 JOURNAL OF THE SOCIETY OF COSMETIC CHEMISTS from each friction test direction and treatment. Each sample was mounted in the same direction onto the specimen holder using double-coated adhesive tape. The specimens were sputter-coated with gold/palladium to an approximate thickness of 500•. All specimens were viewed on an Etec Autoscan © using an accelerating voltage of 20 kV and a 45 ø tilt angle with the tip of the fiber pointing towards the source of the electron beam. RESULTS AND DISCUSSION Effect of Chlorine Concentration and Number of Cycles of Treatment The effects of chlorine concentration and the number of 1-hour cycles of treatment on average values of frictional parameters are shown in Table II. Also included in this table are the values of standard deviations for each data set. Some of these results are illustrated in Figure 3. The results show that the first increment in chlorine concentration (from 0 to 10 ppm) gives increases in the values of the coefficients of friction in both the static and the kinetic modes as well as in both the "with" and the "against" scale directions these increases in values of 3t are statistically significant at 99% level for all three cycles of treatments. Further increase in concentration (from 10 to 50 ppm), however, does not produce further significant change. The effect of the Table II Effect of Chlorine Concentration and Number of Cycles at a Constant pH of 8.0 on Values of Friction "With" Scale "Against" Scale DFE (Static) CycLes ppm •, •k •, 3tk •a -- •w 0* 0 10 50 20 0 10 50 4O 0 10 50 6O 0 10 50 0.181 (.0124• 0.226 (.o251) 0.197 (.0157) 0.309 (.0244) 0.341 (.0341) 0.237 (.0271) 0.339 (.0238) 0.352 (.0231 0.243 (.0066 0.332 (.0557 0.347 (.0129 0.175 0.246 (.0123) (.0076 0.226 0.283 (.0251) (.0223) 0.197 0.285 (.0157) (.0190) 0.309 0.352 (.0238) (.0172 0.337 0.357 (.0315) (.0076 0.237 0.331 (.0271) (.0451 0.335 0.378 (.0224) (.0288) 0.343 0.382 (.0228) (.0386) 0.243 0.338 (.0O66) (.0244) 0.322 0.364 (.0468) (.0346) 0.334 0.366 (.0093) (.0136) 0.226 0.O65 (.c•5o) 0.283 0.057 (.0226) 0.284 0.088 (.0184) 0.347 0.043 (.o155) 0.346 0.016 (.o112) 0.330 0.094 (.0429) 0.374 0.039 (.0319) 0.364 0.030 (.0274) 0.334 0.095 (.0222) 0.352 0.032 (.0291) 0.353 0.019 (.0144) *The 0 cycle, 0 ppm, values were obtained on a tress soaked in water for five minutes and then dried. '•Values in parentheses are standard deviations for n = 5.
Purchased for the exclusive use of nofirst nolast (unknown)
From: SCC Media Library & Resource Center (library.scconline.org)