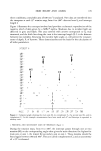
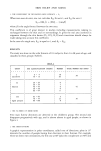
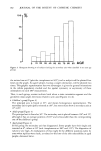
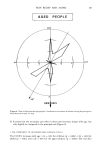
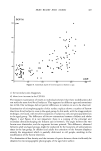
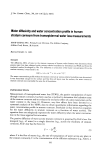
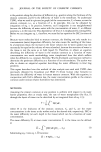
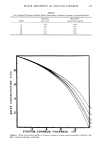
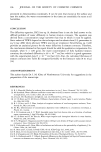
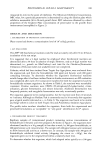
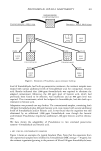
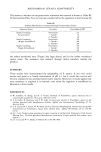
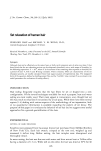
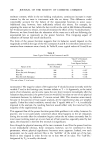
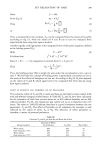
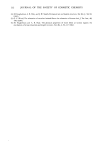
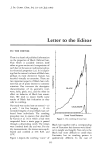
PSEUDOMONAS CEPACIA ADAPTABILITY 201 UNPRESERVED (CONTAMINATED) Formaldehyde Addition Benzoic Acid Addition ppm • (Re sistant• (Resistan%PLUS PLUS• Figure 1. Illustration of Pseudomonas cepacia resistance build-up. level of formaldehyde, had built up preservative resistance, the resistant samples were treated with various additional levels of formaldehyde and, for comparison, benzoic acid. Results indicated that 1,000 ppm formaldehyde was required to eliminate the adapted contaminant. Moreover, the 400 ppm level of benzoic acid, which had previously been found to be effective, was insufficient and an 800 ppm level was required. The contaminants, which had adapted to formaldehyde, had also built up a resistance to benzoic acid. Adaptation was pursued one step further. The contaminated samples, containing both 100 ppm formaldehyde plus 400 ppm benzoic acid, were treated with several additional levels of formaldehyde and/or benzoic acid. It was found that the organism was still eliminated by an additional 1,000 ppm formaldehyde even though the benzoic acid-resistant Pseudomonas required an additional 1,200 ppm benzoic acid for elimina- tion. We have shown the adaptability of Pseudomonas to two unrelated preservative systems--formaldehyde and benzoic acid. 4. MIC VALUES--CONTAMINATED SAMPLES Figure 2 shows an example of a typical Gradient Plate. Note that the organisms from the unpreserved samples were inhibited by formaldehyde (MIC average = 30 ppm), but the resistant organisms (growing in the presence of 50 and 100 ppm formaldehyde) were

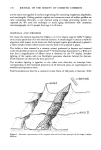
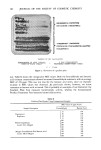
202 JOURNAL OF THE SOCIETY OF COSMETIC CHEMISTS UNPRESERVED PROTOTYPE CONTAINING PSEUDOMONAS "PRESERVED" PROTOTYPE CONTAINING FORMALDEHYDE-ADAPTED PSoeUDOMONAS EXAMPLE OF MIC CALCULATION FORMALDEHYDE IN AGAR (100ppm) WIDTH OF PLATE (90mm) X (MIC FORMALDEHYDE) MEASURABLE GROWTH FRONT (40mm) X = 44ppm Figure 2. Illustration of a gradient plate. not. Table II shows the comparative MIC values. Both the formaldehyde and benzoic acid resistant contaminants showed increased formaldehyde resistance with an average MIC of 270 ppm. This was not true for the benzoic acid series, since no dramatic increase in MIC values was observed. As previously shown, however, we know resistance to benzoic acid occurred. This i• probably an example of test limitation: the Gradient Plate Test measures bacteriostatic activity, whereas the Contaminated Product Treatment Test measures bactericidal activity. Table II Gradient Plate Results Using Contaminated Samples Sample Description MIC Values In ppm Active Formaldehyde Benzoic Acid Unpreserved Replicates With Formaldehyde Levels: 50 to 100 ppm 100 ppm Formaldehyde Plus Benzoic Acid Levels: 300 to 600 ppm 25 3O 44 21 250 280 1.320 250 [150 [360 150 100 110 150 140 130 160 130 110 200 110 250
Purchased for the exclusive use of nofirst nolast (unknown)
From: SCC Media Library & Resource Center (library.scconline.org)