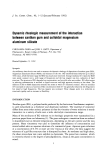
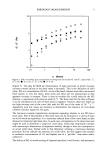
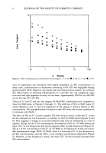
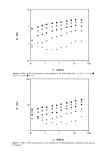
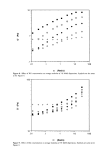
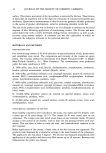
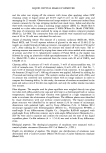
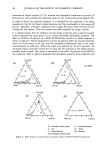
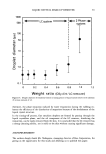
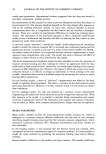
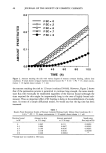
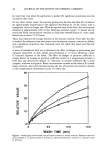
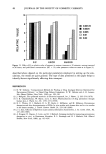
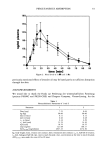
8 JOURNAL OF THE SOCIETY OF COSMETIC CHEMISTS o 100000 10000 1000 100 10 .01 .001 ß ß i ß ß i i i I i ß ß i i , i i I .Ol .1 1 Shear Stress (Pa) Figure 5. Apparent viscosity as a function of shear stress for two MAS dispersions and one xanthan gum solution. /•, 1% MAS A, 3% MAS ß, 0.4% XG. time for structural change to occur, the elasticity provided by the two components should be additive. Indeed, at 10 rad/s and above, the G' values in Figures 8 and 9 increase with XG concentration. According to this model, XG molecules in the mixed dispersions are joined in a manner similar to their arrangement in pure gum systems. This is in accord with the finding that dispersions containing both components remain in the linear viscoelastic region at higher strain values than dispersions containing only MAS (Figure 1). The presence of XG should also provide additional "smoothness" to the dispersions when it flows. CONCLUSIONS The substances discussed in this paper (MAS and XG) utilize different mechanisms of structure formation in aqueous dispersion. Nevertheless, depending on their ratio, both materials contribute to the viscous and elastic properties of the network that exists in essentially undisturbed mixtures. MAS provides rigidity XG augments the viscous component. The behavior of the mixtures is, in many respects, intermediate between that of the components. Compared to MAS alone, mixtures with XG exhibit a larger linear viscoelastic range, and higher values of G" and loss tangent. These changes, along with differences in the pattern of G', suggest a reduction in structural rigidity and an increase in flexibility.

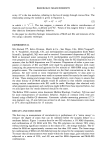
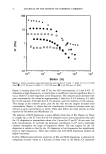
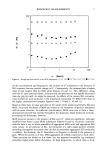
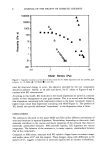
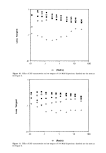
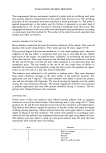
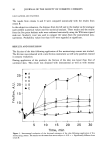
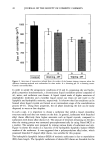
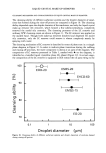
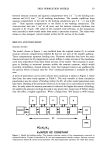
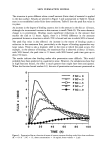
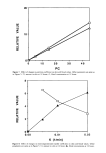
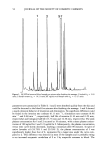
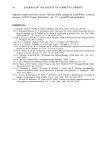
10 .01 .01 ß ß ß ß ß ß ß [] [] [] ß [] ß [] [] [] ß ß [] ß ß ß [] ß ß [] ß 0 0 0 ß 0 ß ß 0 0 0 o + + o o + + + + + + + .1 1 lO lOO o) (Rad/s) Figure 6. Effect of XG concentration on loss modulus of 1% MAS dispersions. +, 0% C), 0.1% O, 0.2%' [], 0.3% I, 0.4%. lOO n 10 ß ß ß ß [] ß [] [] ß ß ß [] ß ß ß [] [] ß o [] [] ß o [] [] ß ß o • ß ß o o + o o o + ....... i ß ß ß ..."1 ß ß ß ß ,..i ß ß ß ß .... .Ol .1 1 lO lOO o) (Rad/s) Figure 7. Effect of XG concentration on loss modulus of 3% MAS dispersions. Symbols are the same as for Figure 6.
Purchased for the exclusive use of nofirst nolast (unknown)
From: SCC Media Library & Resource Center (library.scconline.org)