TWO TESTS OF DETERGENT IRRITANCY 143 IMMERSION PROTOCOL One month after the patch test procedure, the immersion experiment was started. Since three products were evaluated, the hand/forearm immersion protocol was repeated after an interval of at least two weeks. The protocol consisted of one immersion for 30 minutes daily for three consecutive days (24-hour interval). The three products were tested at 2% solutions in distilled water. The effect of immersion in distilled water only was also evaluated. The solutions were put in a plastic tank and heated at 40øC by means of a thermal stirrer. A randomization procedure among the volunteers was used in order to avoid the influence of time and left-right variations. After the immersion, the hand and forearms were rinsed with tap water and gently dried with a soft towel. Measurements were carried out before each immersion and at 8 and 24 hours after the third immersion. INSTRUMENTS Skin irritation can now be objectively quantified using noninvasive biophysical deter- mination of skin properties. Skin irritation is accompanied by a decreased barrier func- tion, a decreased water content of the upper skin layers, and a reddening of the skin. The above-mentioned skin parameters were measured in our experiment. Transepidermal water loss (TEWL) was determined using the Tewameter TM820 © (Courage & Khazaka, Cologne, Germany). The guidelines as prescribed by Pinnagoda et al. (11), were followed. Dehydration of the upper skin layers was estimated using the Corneometer © (Courage & Khazaka, Cologne, Germany), measuring epidermal capaci- tance (12). Skin color was assessed using the Chromameter CR200 © (Minolta Camera Co., Ltd., Osaka, Japan) registering color luminance (L*) and hues a* and b* (a* ranging from green to red and b* ranging from yellow to blue). The a* value is especially used for the registration of skin redness (13). Measurements were carried out under controlled environmental conditions (20øC + 2øC and relative humidity 45% + 5%) after an acclimatization period for the volunteers of 30 minutes. DATA TREATMENT AND STATISTICS Data were tested for normality using the Kolmogorov goodness-of-fit test. Differences between the kinetics obtained for the different products were analyzed using the MANOVA procedure, evaluating the effect of the product, the effect of time, and the combination of product and time within one single test. Besides the kinetics, we equally compared the global response. The global response is calculated as the algebraic sum of the values obtained at the different measurement intervals. Hence, we calculated the global TEWL response (•TEW•), the global hydration response (•i•yd), and the global color response (•a*) for every evaluated product and the included controls. Global response after, respectively, the patch and the hand/forearm immersion tests, was com- pared using the ANOVA procedure. The significance level was set at 5 %. The relation between the results obtained in the two experimental protocols (patch test and hand/ forearm immersion test) was calculated by simple linear regression using the global response as calculated for the different products.

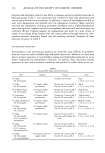
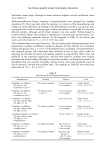
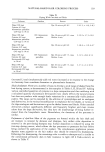
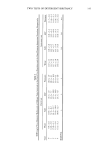
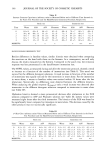
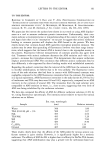
144 JOURNAL OF THE SOCIETY OF COSMETIC CHEMISTS RESULTS PATCH TEST Compared to the untreated reference, application of the Hill Top chamber, alone or with water, did not cause any effect on the selected skin parameters. As a consequence, we can compare the results of product application with the values obtained after application of the Hill Top chamber with water alone, considering the latter as blank. We chose this blank because it corresponds better to the immersion in water alone, used also in the hand/forearm immersion protocol. The latter permits a more realistic comparison be- tween the two test procedures (comparison between the patch test and the hand/forearm immersion test). When evaluating the kinetics obtained after application of the three products, a marked increase in TEWL values is detected for the three test products (see Table I). The strongest increase is observed for N28, a weaker increase for ASV, and the weakest increase for Plantaren. Values remain increased up to 48 hours after removal of the second patch. At that time, a similar rank order is detected with highest values for N28, lower values for ASV, and the lowest values for Plantaren. The MANOVA procedure detected statistically significant changes between the kinetics of the three applied prod- ucts when compared with the Hill Top Chamber containing water. Analysis of the global response (ZTEWL) revealed similar results: the strongest response was observed on the skin side challenged with N28, lower values for ASV, and the lowest values for Plantaren (see Table IV). The ANOVA procedure detected significant differ- ences between the tested products and the control equal statistical differences were observed between N28 and the other two test products (ASV and Plantaren, respec- tively). The capacitance values were decreased after repetitive application of the different test solutions, indicating a dehydration of the stratum corneum (see Table II). Differences between the kinetics of the three products were less clear. However, at the last interval, the lowest values were detected for N28. Statistically, we were able to detect a signifi- cant difference between the kinetics of the different test products and the control. The global response (Y'•4yd) delivered similar results, the lowest values for N28, followed by Plantaren and ASV, respectively (see Table IV). Again the responses to the three evaluated products were significantly different from that of the control. No differences were detected when comparing the global responses of the three products. Skin redness, as evaluated by the a* color value, demonstrated equally a marked increase after application of the three products (see Table III). N28 showed the strongest increase, a weaker increase was noticed for ASV, and the weakest response was detected for Plantaren. Values at 48 hours after the end of the patch test did not return to baseline. At that time, a similar redness rank order was detected: N28 ASV Plantaren. The kinetics of the applied products differed significantly from the application of water alone. The global a* response (Y'a*) showed the same rank order. Significant differences were detected when comparing the Y,a. values calculated for the different test products with the Y,•. values calculated for the reference (see Table IV).
Purchased for the exclusive use of nofirst nolast (unknown)
From: SCC Media Library & Resource Center (library.scconline.org)