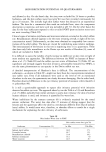
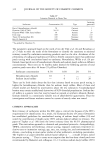
284 JOURNAL OF THE SOCIETY OF COSMETIC CHEMISTS legitimate manner were first published by Tippett in 1931. These techniques are widely recognized today in the statistical and clinical literature, even though the actual term "meta-analysis" was introduced by Glass in 1976 in a study of psychotherapy (1-11). Chalmers estimated in 1991 that in excess of 150 meta-analyses of randomized clinical trials had been published in the English language, and that new ones were appearing at an increase of over 15 % per year (12). Meta-analysis has been applied to a diverse number of problems ranging from agriculture to medicine, psychology, education, and even cloud seeding (12). It is a particularly powerful technique for pooling data from several studies conducted under a common protocol with common treatment comparisons. In developing a new product, numerous small screening studies are normally conducted to guide final formulation. These screening studies represent a significant time and capital investment for a company, and can be an important resource for estimating treatment effects. For example, multiple small studies to investigate formulation and/or processing variables provide the researcher with information about the range of factors that can be altered without affecting product performance. Screening studies are often considered individually when making decisions at a particu- lar stage of a project, with a larger study conducted at the end of development to support claimed benefits prior to marketing the product. For example, suppose that a researcher has tested numerous formulation or processing variables in the development of the final product. Each of these small studies provides the researcher with information about the range of factors that can be altered without affecting product performance, even though the studies may not be large enough to show statistically significant differences versus a benchmark control. However, combining data from a number of these small studies can produce an estimate of treatment differences that is more reliable and more generally applicable than data from a single large study. The reason for this is that a single large study is usually conducted under a limited breadth of factors that could impact perfor- mance. Examples of these types of factors are weather conditions, season of the year, geographical location, local population, and product batches. By combining data from smaller studies, a more realistic estimate of the true treatment effect can be made. Due to the wide application and popularity of meta-analysis techniques, there is a growing number of publications providing cautions and guidelines for the appropriate use of meta-analysis. These focus on issues such as establishing criteria for the inclusion of studies in meta-analysis, evaluating the quality and weighting of individual trials, and minimizing publication bias (3,8,13-15). As summarized by Olkin in Science, "Doing a meta-analysis is easy. Doing one well is hard" (16). METHODS Three forearm controlled application technique (FCAT) screening studies were con- ducted from April 1994 to February 1995, comparing the clinical mildness of a new mild cleansing bar with a marketed mild cleansing bar as a benchmark (17). Visual dryness and lBS capacitance data from these studies were pooled by meta-analysis techniques to estimate the difference in mildness between these two mild bars. In March 1996, an FCAT study enrolling 105 subjects was conducted to compare treatment difference estimates provided by the meta-analysis.

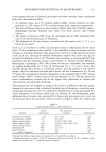
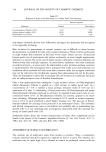
META-ANALYSIS 285 STUDY DESIGN All four studies were conducted according to a forearm controlled application technique protocol (FCAT) (17). The FCAT technique has been shown to yield relative mildness rankings that correlate with consumer experience. Subjects were healthy female volun- teers, aged 18-55, with Fitzpatrick skin types I-IV and forearm visual redness and dryness grades less than 3.0 on a 0-6 point scale with potential 0.5 increments. The studies were limited to female subjects because the bars compared were both intended to be marketed to women who use beauty bars. All subjects provided informed consent. Each screening study enrolled 20-25 subjects, whereas the larger study enrolled 105 subjects. The former studies were designed only to show directional rankings of product mildness. The latter was sized to show a difference as large as 0.17 in visual dryness (the estimate from meta-analysis), with at least 95% confidence and 80% power. Each study was randomized according to a Latin Square design. In this design, subjects received all treatments, and treatments were represented approximately the same num- ber of times on each of the eight treatment sites on the volar forearms. This is a well-recognized design that has been employed since the early 1950s (18,19). It accounts for biological differences among subjects and between application sites on the arm of a given subject, and for the order of treatment application, so that these differences do not unfairly bias treatment outcomes. TEST PRODUCTS The test products of interest were two commercially available mild cleansing bars. Each of the three screening studies included other personal cleansing bars and liquids that addressed objectives outside this publication. Only treatment estimates for the two mild cleansing bars of interest were common to all three screening studies and were included in the meta-analyses. The larger study included only the two mild cleansing bars of interest, with a total of four replicates of each being assigned to each subject. EVALUATIONS The skin condition on each treatment area was evaluated by an expert grader at baseline and three hours after the final study wash. A 0-6 scale with half-point increments was used to score dryness. Skin capacitance readings were also collected at each of these time points in duplicate, using a skin surface hydrometer manufactured by I.B.S. Co., Ltd., Japan. This measurement provides an indirect measure of moisture content in the skin. DATA ANALYSIS An analysis of variance model for the individual study data that accounted for subject- to-subject, side-to-side, and site-to-site variability and treatment effect was used in each study. These sources of variability have been noted historically (20). The general model for an observed response in this case can be expressed by: response/j•/m = la + T i + Sj + A• + P/ + SAj• + eijkl m
Purchased for the exclusive use of nofirst nolast (unknown)
From: SCC Media Library & Resource Center (library.scconline.org)