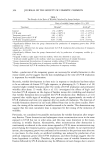
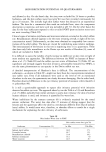
286 JOURNAL OF THE SOCIETY OF COSMETIC CHEMISTS where ia is the grand mean T, the effect due to the ith treatment S, the effect due to the jth treatment site A, the effect due to the side (right or left) to which the treatment is applied P, the effect due to the lth subject SA, the site-by-site interaction term and ½, an error term that includes experimental error and error due to uncontrolled factors. From this model, least-squares means for treatment effects, with associated standard errors, were estimated. Skin capacitance data were log transformed prior to analyses to stabilize the variance and correct the skewness of the distribution. A logarithmic rela- tionship between skin capacitance and moisture content had been presented previously (21). To combine the three screening studies, both unweighted (equally weighted) and weighted meta-analyses were performed on dryness and skin capacitance data according to documented techniques to estimate overall mean differences between the products (3,4). Appropriate tests for homogeneity were performed prior to pooling the data. Weights were derived from the variability associated with treatment differences for the weighted analyses. Simpler techniques, such as Fisher's technique and the inverse normal technique (4), exist for establishing overall p-values over a series of tests. However, the techniques chosen had the advantage of estimating the actual difference between treat- ments as well as estimating overall p-values, whereas the simpler procedures do not provide estimates of treatment differences. The estimates from the weighted and un- weighted analyses were compared with each other and with the results of the larger study for consistency. The protocol for meta-analysis was more straightforward than those usually encountered when pooling treatment estimates from literature sources. All the data that had been generated by the FCAT protocol comparing the two bars were available and were included in the meta-analyses. Thus, publication bias and selective inclusion of studies were not issues. Publication bias is the phenomenon whereby positive results that show treatment differences are more likely to be published than those that do not. All data were generated through a contract research organization. Each of the studies was ran- domized, blinded, and conducted in compliance with Good Clinical Practices guide- lines. Thus, the quality of the studies included in the meta-analysis is not an issue. RESULTS AND DISCUSSION Weighted meta-analysis combining data from the screening studies shown in Table I estimated the visual dryness difference between the two mild cleansing bars, denoted bars 1 and 2, respectively, to be 0.167 + 0.079 (p-value = 0.035). The p-value is the probability that a difference as large as the one observed would be detected by random Table I Day 5 Changes From Baseline in Visual Dryness Estimates From Screening Studies Clinical trial Std. Std. Mean n Bar 1 error Bar 2 error delta P-value Screening study 1 Screening study 2 Screening study 3 22 0.317 0.075 0.519 0.104 0.202 0.1189 20 0.467 0.073 0.698 0.127 0.231 0.1183 20 0.567 0.098 0.637 0.098 0.070 0.9564

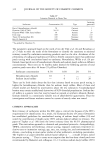
META-ANALYSIS 287 chance if no true difference existed. The estimated difference from the unweighted analysis was 0.168 + 0.080 (p-value -- 0.036). The visual dryness difference between treatments estimated from the larger study was 0.194 + 0.040 (Table III). The p-value was less than 0.0001. This showed bar 1 to be significantly less drying than bar 2. For lBS capacitance, the weighted meta-analysis of the screening data shown in Table II estimated the difference on a logarithm scale between the two bars to be -0.039 + 0.013 (p-value -- 0.004). The estimated difference from the unweighted meta-analysis was -0.042 + 0.015 (p-value = 0.006). The larger study estimated the treatment difference to be 0.023 + 0.004 (p-value = 0.0001, Table III). Sites treated with bar 1 showed significantly higher capacitance than sites treated with bar 2. Data from five subjects from the screening studies could not be used in the meta-analysis because the subjects withdrew prior to the final examination for non-product-related reasons. Six subjects were not included in the analysis of the larger study due to withdrawal prior to the final examination. Five of these subjects withdrew for non- product-related reasons. The investigator indicated that the remaining subject who withdrew may have had a product-related effect. Upon investigation it was discovered that the subject exhibited redness on one of the eight treatment sites, but had also spilled hot coffee on this site. None of the other three treatments sites receiving the same product showed redness. CONCLUSION Estimates of treatment differences from the meta-analyses of the screening study data closely paralleled the estimates derived from the large-based study and had the advan- tage of controlling for more external sources of variability. This validates the use of meta-analysis of smaller screening studies conducted under the same protocol to reliably estimate treatment differences from clinical tests to evaluate product performance at- tributes. Pooling a series of smaller studies by meta-analysis is a cost-effective way of estimating the difference between treatments. When meta-analysis is used in this manner, it is important that all the data be included. Otherwise a clear explanation of why data were omitted should be provided because selective inclusion of studies can lead to a biased answer. When meta-analysis is used to combine data collected under a protocol that is reasonably consistent with normal use conditions, as with the FCAT protocol, the treatment estimates provide a reliable indication of the treatment effects that will be experienced when the products are marketed to consumers. Table II Day 5 Changes From Baseline in Log10 (Skin) Capacitance Estimates From Screening Studies Std. Std. Mean Clinical trial n Bar 1 error Bar 2 error delta P -value Screening study 1 22 -0.033 0.009 -0.069 0.013 -0.036 Screening study 3 20 -0.032 0.018 -0.079 0.018 -0.047 0.0227 0.0635 Note: skin capacitance was not collected in screening study 2.
Purchased for the exclusive use of nofirst nolast (unknown)
From: SCC Media Library & Resource Center (library.scconline.org)