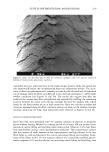
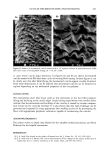
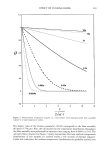
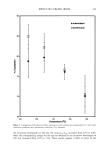
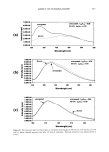
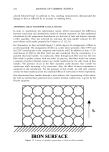
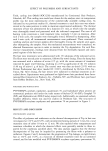
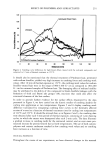
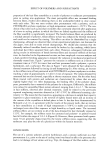
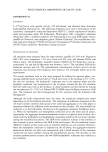
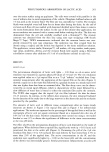
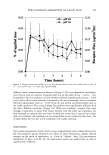
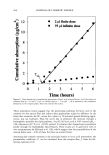
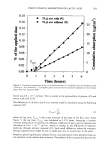
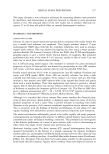
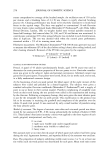
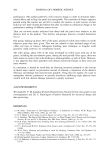
DENTAL STAIN PREVENTION 279 associated with each paste were also recorded. However, owing to exercise of the pan- elist-withdrawal option during use of the 1ow-abrasivity paste, comparable total stain scores for all the pastes were not possible. Pastes. Four pastes were tested, representing a range of abrasivity from substantially zero to that typically found in regular toothpastes on the market. The abrasive performance of the pastes was determined by the new in vitro method at product concentrations of 33% by weight, slurried in water. The pastes were formulated to contain base ingredients typical of currently marketed "silica" formulations (sorbitol, sodium lauryl sulphate, and flavor). Thus the principal water-insoluble components were both thickening and abrasive-type amorphous silicas and opacifying levels of titanium dioxide. Of these, only the abrasive silicas exhibit any significant abrasive function. Experimental pastes were made containing zero, 2%, 4%, and 10% by weight of a typical commercially available abrasive xerogel silica (Gasil © 200TP, Crosfield Chemicals Ltd., Warrington, UK). This abrasive is representative of the efficient, high-strength, angular dental silicas of 5 to 10 microns average particle size used extensively in modern toothpastes. The unoccupied formulation space in the pastes containing less than 10% abrasive silica was filled with sorbitol and thickening silica in proportions necessary to maintain the viscosity and flavor of the 10% variant. RESULTS IN VITRO ABRASIVE EFFICIENCY The performance of the four pastes is shown graphically in Figure 1. Abrasive removal of the FT film from the polished HAP discs is plotted against the number of brush head oscillations applied. In this method it will be seen that the most efficient pastes reach a cleaning plateau at about 100 oscillations, and that the same order of effectiveness between pastes is ob- served at 50, 100, and 150 oscillations. Equally, rates of cleaning differentiate the pastes in the same order. A convenient simple expression of comparative abrasive performance was taken to be the percentage clean at 100 oscillations (FT-100 score). Under these conditions, mean differences of 5 percentage units are required for significance (p 0.01). Thus the in vitro performance of the pastes containing 10% and 4% abrasive silica was not substantially different, but a marked reduction was apparent for the 2% abrasive silica paste, with only slight abrasive cleaning provided by the zero-abrasive variant. No soil removal was observed after brushing with typical water-soluble components of pastes (e.g., humectant, surfactant), suggesting that the added titanium dioxide opacifier may be providing a small degree of abrasion. IN VIVO STAIN-PREVENTION EFFICIENCY In Table I below performance is expressed both as the percentage of the panel exhibiting visible stain (2,3 scores) on at least one site and as the mean total-stain score per panelist

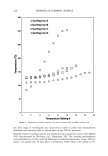
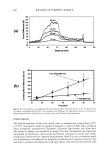
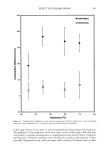
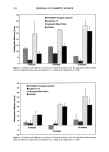
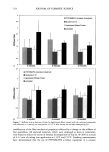
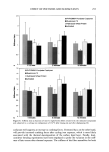
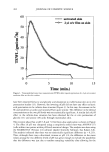
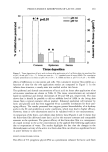
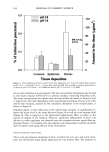
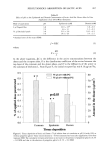
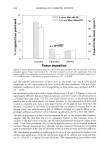
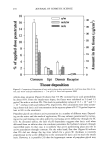
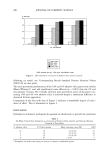
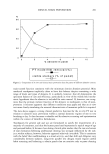
280 JOURNAL OF COSMETIC SCIENCE % removal 8ø I 6O 4O 2O 100 no. oscillations 150 [] zero abr :'D 2% abr •'D 4% abr [] 10% abr 33% paste slurry 150 cpm oscillation rate Figure 1. Film removal as a function of abrasive silica content of paste. following six weeks' use. Corresponding British Standard Dentine Abrasion Values (DAV) (8) are also given. The stain-prevention performances of the 10% and 4% abrasive silica pastes were similar (Mann Whitney U test) and significantly more effective (p 0.001) than the 2% and zero-abrasive versions. The virtually identical stain-prevention action of the pastes con- taining 10% and 4% w/w abrasive silica is achieved despite a substantial difference in measured dentine aggression. Comparison of the data with that of Figure 1 indicates a remarkable degree of coinci- dence of effect. This is illustrated in Figure 2. DISCUSSION Formulators of abrasive toothpastes for general use should aim to provide the maximum Table I Six-Week Clinical Stain Formation as a Function of Abrasive Silica Content and Dentine Abrasion Potential of Four Pastes % Abrasion silica % Visible stainers Mean total-stain score (SE) DAV 10 19 4.2 (0.33) 55 4 19 4.7 (0.35) 30 2 32 9.5 (0.34) 17 0 65 11.2' 5 * Incomplete six-week score owing to exercise of cosmetic withdrawal option.
Purchased for the exclusive use of nofirst nolast (unknown)
From: SCC Media Library & Resource Center (library.scconline.org)