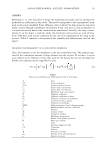
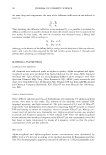
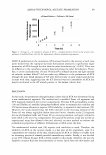
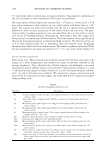
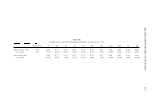
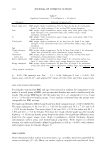
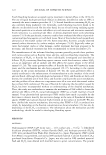
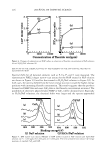
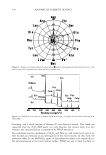
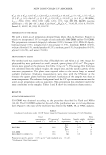
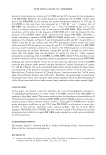
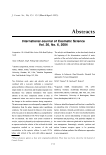
QUANTITATIVE MODEL OF CELLULITE 111 t-test was used for comparison of two different groups. Correlation coefficients were computed using Pearson Product Moment or Spearman procedures (non-normally dis tributed data) in order to evaluate relationships among parameters. Multiple linear regression analyses were carried out to determine the ability of a combination of inde pendent variables to predict the dependent variable. RESULTS QUANTITATION OF CELLULITE SEVERITY Selection criteria for the ten final images of the 0-9 expert image grading scale (Figure 2) included depth of dimples, area of coverage, and cottage-cheese-like appearance. Correlation of the expert image grades with the surface roughness parameters (Table III) indicated the highest association (correlation coefficient = 0.86, p = 0.008) for Svm (Figure 3). Parameter Sdr was also highly correlated with the expert image score (cor relation coefficient = 0.86, p = 0.002). Inclusion of the non-correlated variables Ssk and Sku in the multiple linear regression analysis did not add significantly to either model. Grade 0 Grade 1 Grade 2 Grade 3 Grade 4 Grade 5 Grade 6 Grade 7 Grade B Grade 9 Figure 2. Expert image grading scale. Three experts reviewed 66 3D laser scans that covered the range of severities observed in the general population, identified the cellulite features, and developed a ten-point classification scale of cellulite severity (0-9). A grade of 0 represented no cellulite 1, 2, and 3 indicated varying degrees of slight cellulite 4, 5, and 6 were moderate and 7, 8, and 9 were severe. Ten images, representing each point (0-9), were established as the expert image grading scale and used for evaluation by na'ive judges.

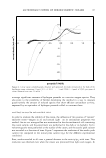
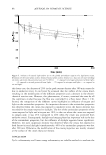
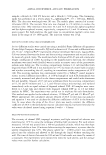
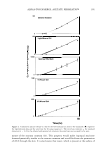
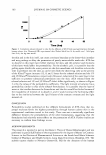
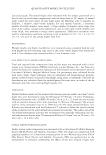
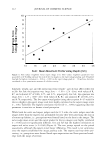
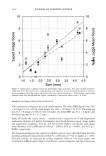
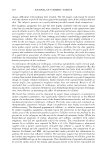
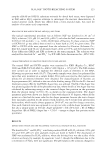
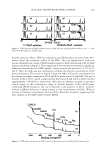
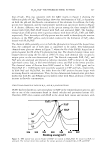
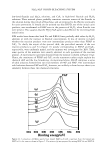
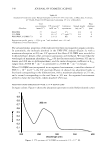
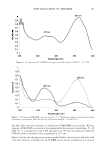
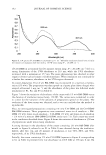
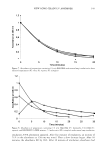
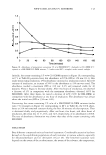
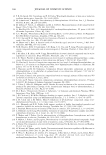
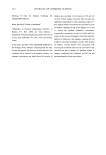
112 JOURNAL OF COSMETIC SCIENCE 10 �---------------------------, 9 8 (I) 7 C) � ctJ o E 6 u- (f) (I) (I) ctJ 5 u ctJ (f) 4 E� t O 3 (I) C) c..2 X ctJ 2 UJU 1 0 1.0 • 1.5 2.0 2.5 3.0 3.5 4.0 4.5 Svm: Mean Maximum Profile Valley Depth (mm) Figure 3. Skin surface roughness versus expert image score. Skin surface roughness parameters were quantified with TrueMap software for each of the ten images on the expert image grading scale. Parameter Svm had the highest correlation (r = 0.86, p = 0.001) to the expert image grade (n = 10) and was, therefore, considered to be a quantitative measure of cellulite severity. Similarly, weight, age, and the interaction term (weight · age) did not affect either Svm or Sdr. For Svm, the equation was: Image Score = -1. 66 + (2.4 · Svm), with values of R, R2 , and adjusted R2 of 0.86, 0.75, and 0.71, respectively. For Sdr, the equation was Image Score= 1.25 + (388 · Sdr)) with values of R, R2 , and adjusted R2 of 0.86, 0.73, and 0.70, respectively. The live expert visual grades (using the ten-point 0-4.S scale) for the ten thighs in the expert image scale were highly correlated to the expert image scores (r = 0.92, Table III). The highest correlation was for Sdr (r = 0.89), suggesting that this parameter is sensitive to human visual perception. While both the nai·ve and expert judges used the 0-9 scale, the na'ive judges rated the images lower than the experts did, presumably because they were processing the data in a bottom-up fashion, i.e., perceptions were formed based on the data in the images. The na'ive judge mean scores and the expert grades for the ten images were highly correlated (r = 0.96) and not significantly different. Svm and Sdr had the highest correlations to expert and nai·ve scores (r 2: 0.86) (Figure 4). The two groups agreed on the paired assessments, although the experts noted larger differences. This result is not surprising, since the experts established the image grading scale. The experts used top-down pro cessing, i.e., perceptions were formed based upon expectations and from previous knowl edge with the range of severity.
Purchased for the exclusive use of nofirst nolast (unknown)
From: SCC Media Library & Resource Center (library.scconline.org)