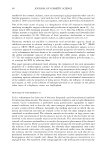
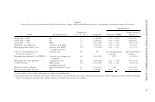
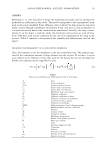
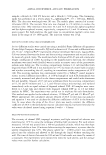
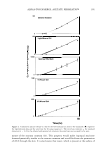
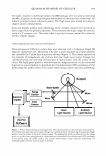
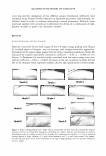
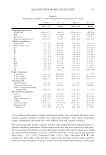
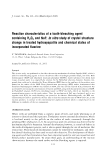
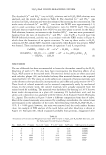
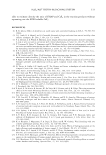
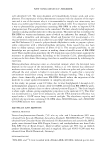
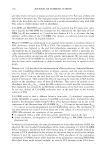
Table III Cellulite Score and Surface Roughness Parameter Correlations (n = 10) Visual score Sa Sq Sp Sv St Ssk Sku Expert image score 0.92 0.76 0.75 0.67 0.67 0.76 0.39 -0.32 (r, p value) 0.00 0.0ll 0.013 0.033 0.033 0.0ll 0.269 0.361 Live visual score 0.82 0.77 0.79 0.51 0.71 0.56 -0.71 (r, p value) 0.002 0.007 0.004 0.126 0.019 0.081 0.019 Spm Svm Sz 0.78 0.86 0.83 0.008 0.001 0.003 0.86 0.83 0.86 0.000 0.000 0.000 Sdr 0.86 0.002 0.89 0.000 12) C � f--1 � f--1 - tTJ � 0 d r 0 'Tj CJ C -r f--1 tTJ """"' """"' v.J

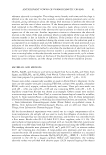
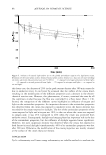
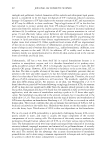
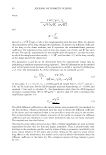
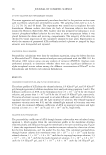
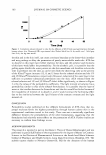
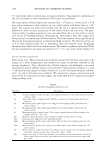
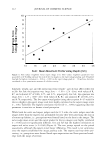
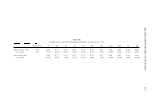
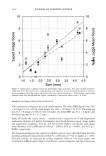
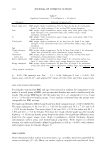
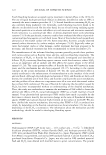
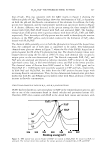
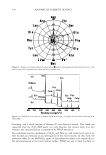
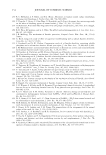
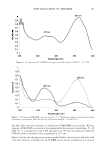
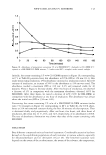
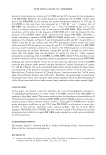
114 � 0 0 en Q) C) m E t:: Q) a. 10 8 6 4 2 o JOURNAL OF COSMETIC SCIENCE . . ............ ............ ............ -:· ............ :· ............ :· ............ � . . . . . . - . . . . . . . . . . . . . . : : Ea : : / . /: . . . . . . . . . . ............ � ......... ' ... : ............. : .......... . ··:··/······:············ /. . :/� � /: . : . . . . ............ , ................ . ·························"'························· . . . . . [!I I ·, . /. . . � . . ! : 4: : : : ........ - � 1/-·. riJ· - � - ........... ·· : ........... ·i ........... ) ........... -�: ........... . :a: i ! i m � i : i i : . . . . ' • I • o • . . . . . ' . . . . . --------1-�- ... ------..--------------------- 1.0 1.5 2.0 2.5 3.0 3.5 Svm (mm) 4.0 4.5 10 8 6 4 2 a � 0 0 en C: m Q) � Q) C) "'C ::J --, Q) . m z Figure 4. Quantitative roughness evaluation and human image assessment. The expert grades and nai"ve judge mean scores for the ten expert-image grading scale images are plotted versus the quantitative cellulite severity parameter Svm. The expert and na · ive scores were highly correlated (r = 0.96) and not significantly different. Both Svm and Sdr had the highest correlations to expert and na · ive scores (r � 0.86). BIOPHYSICAL CHARACTERIZATION OF CELLULITE Fifty-six females completed the study measurements. The mean BMI (kg/m2) was 34.6 ± 8 (range 21-57), and the mean weight was 204 ± 52 (range 128-331). The mean age was 44.3 ± 8 (range 21-60). For the ten males, the mean BMI was 33.2 ± 6 kg/m2 and the mean age was 41.8 ± 11.2 years. Table IV shows the results (mean ± standard error, range) for all of the biophysical evaluations (females and males). Correlations were found between expert image grades and quantitative roughness. Svm, Sz, and Spm had the highest correlations with image score (females), with coefficients of 0.69 (p 0.001), 0.68 (p 0.001), and 0.62 (p 0.001), respectively. The biophysical features that related to cellulite severity were identified from the rela tionships among all measurements (Table V, coefficients of �0.4 or higher, p 0.05). Cellulite severity, as measured by surface roughness (Svm) or live visual grade, was correlated to BMI (weight), thigh circumference, percent thigh fat, and the architecture
Purchased for the exclusive use of nofirst nolast (unknown)
From: SCC Media Library & Resource Center (library.scconline.org)