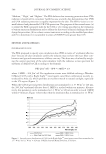
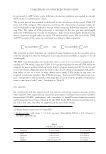
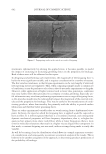
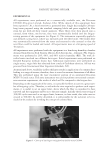
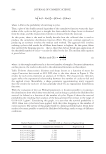
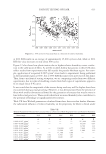
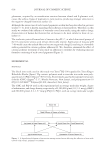
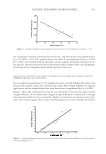
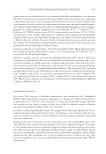
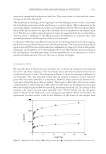
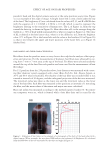
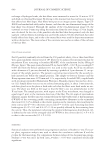
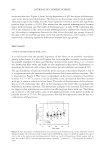
FATIGUE TESTING OF HAIR 603 EXPERIMENTAL All experiments were performed on a commercially available unit, the Dia-stron CYC800 (Dia-stron Limited, Andover, UK). While details of this equipment have been reported (7,8), a brief overview is presented here. Single hair samples (28-mm- long) were prepared using the standard crimping block and press supplied by Dia- stron for use with all their tensile analyzers. These fi bers were then placed onto a carousel, from where, one-by-one, they were automatically loaded into the fatigue- testing portion of the equipment (see Figure 3). The instrument repeatedly applied a user-defi ned cycling force, which was repeated until the fi ber broke. The broken fi ber was automatically removed from the tester and returned to the carousel so that the next fi ber could be loaded and tested. All experiments were at a fatiguing speed of 40 mm/sec. All experiments were performed with the equipment in a bench-top humidity chamber obtained from Electro-Tech Systems (Electro-Tech Systems Inc., Glenside, PA). Experi- ments were performed at 20%, 60%, and 90% relative humidity (RH). The work de- scribe herein involved two different hair types. Initial experiments were performed on blended European medium brown hair. Additional experiments were performed on single-source, virgin Afro hair obtained from a male of Caribbean ethnicity. All hair was procured from International Hair Importers (Glendale, NY). As mentioned above, variability in fi ber thickness results in application of a common force leading to a range of stresses therefore, there is a need to measure dimensions of all fi bers. This was performed using the laser micrometer portion of an automated Dia-stron MTT675 tensile tester. This same instrument was used to perform conventional constant- rate extension experiments, the results of which will be compared to the fatigue data. Depending on the magnitude of the stress, it is possible for fi bers to survive a great num- ber of fatiguing cycles. Therefore, to aid with the time required to perform such experi- ments, it is useful to set an upper limit, above which the fi ber is considered to have survived and the equipment moves on to the next sample. Initially the factory setting of 300,000 cycles was used as an upper limit however, in later work, this value was in- creased to 500,000. As will be described, it is still possible for the survivors to be in- cluded in the analysis by invoking the concept of censored data. Figure 3. Close-up of the fatigue testing head on the Dia-stron CYC800.

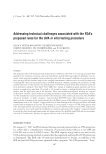
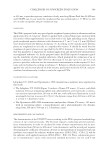
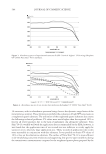
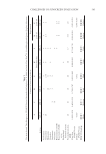
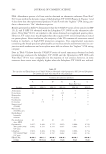
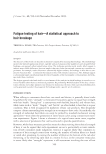
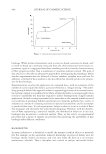
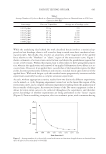
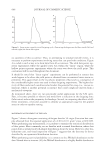
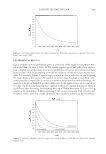
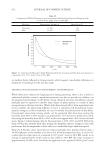
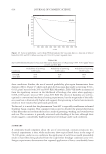
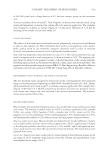
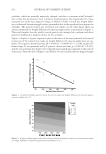
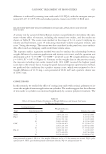
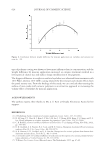
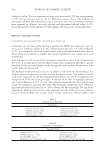
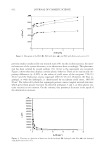
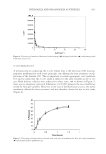
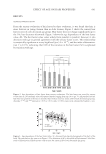
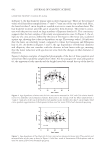
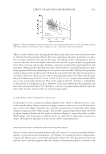
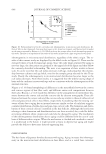
JOURNAL OF COSMETIC SCIENCE 604 INFLUENCE OF FATIGUING STRESS MAGNITUDE ON THE NUMBER OF CYCLES-TO-FAIL—THE S-N CURVE Instinctively, the magnitude of the fatiguing stress would be expected to have an infl u- ence on the number of cycles-to-fail. That is, samples that receive a higher fatiguing stress will have a tendency to fail faster. In fatigue testing this relationship is commonly represented by what is termed an S-N curve, where the stress is plotted against the loga- rithm of the number of cycles to failure. Figure 4 shows such a plot for Caucasian hair equilibrated at 60% RH. From the regression line it becomes possible to evaluate an average number of cycles-to- break as a result of the applied stress. Table I shows this information and also, for easier reading, converts the stress back into a force based on an average-sized 70-um fi ber. From conventional constant-rate extension testing, it can be determined that, on average, a healthy 70-um hair fi ber typically breaks upon application of an approximate 80 g force at 60% RH. However, from Table I, it can be seen that repeated application of a 55 g force on a 70-um hair fi ber would be expected to induce breakage after around 400 cycles. In fact, results suggest that a repeating force that is only half that of the break force would still be expected to induce breakage after approximately 14,000 cycles. This illustrates the point made previously regarding the relevance of results obtained from conventional stress-strain experiments with regard to actual consumer practices. While the regression line allows for an estimation of the number of cycles-to-fail under a given repeated stress, from Figure 4 it is clear that there is considerable spread in the data. A repeating 40 g force on a 70-um fi ber may result in an average of 14,000 cycles-to- break, but breakage occurred as early as 1000 cycles, and some samples survived all 300,000 cycles. As will be shown later, this distribution is used in the analysis and mod- eling of the likelihood of breakage. From these results, it is possible to observe an exponential relationship between the stress and the number of cycles-to-break (Figure 5). Thus, we begin to visualize how a reduc- tion in grooming force (as provide by conventional conditioning products) has a dramatic infl uence on the propensity for hair breakage. This is an area that will be discussed more fully after outlining the data analysis method. Figure 4. S-N curve for Caucasian hair at 60% RH.
Purchased for the exclusive use of nofirst nolast (unknown)
From: SCC Media Library & Resource Center (library.scconline.org)