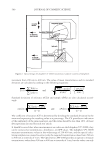
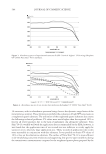
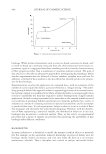
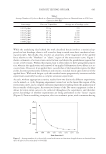
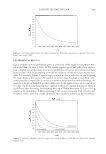
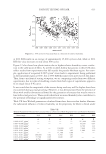
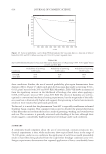
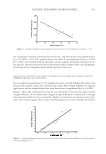
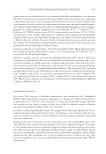
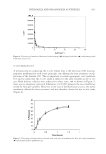
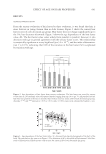
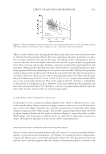
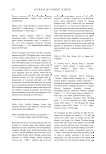
EFFECT OF AGE ON HAIR PROPERTIES 639 panelist’s head and the digital camera were set at the same positions every time. Figure 1a is an example of this type of image. A bright luster belt is seen a little under the top of the head. The brightness (L) was calculated from the values of R, G, and B of RGB data with the equation of L = 0.299R + 0.587G + 0.114B, which is used to represent the brightness relating to the sensitivity of human eyes. The L of Figure 1a, from the top toward the hair tip, is shown in Figure 1b. Here this value of L is the average along the width of ca. 30% of head width (surrounded by a white rectangle in Figure 1a). The value of ΔL is defi ned as the hair luster value, where it is the difference in L from the brightest value (171 in Figure 1b) at the luster belt and the value at the baseline (38 in Figure 1b) so that it ties between the upper and lower positions of the luster belt, as in Figure 1b (dashed line). HAIR SAMPLES AND THEIR CHARACTERIZATION Hair fi bers from the panelists were cut very close to the scalp for the analyses of hair prop- erties and structure. For the measurements of diameter, hair fi bers were obtained by cut- ting from 7-mm × 7-mm areas at the top of the head. Ten fi bers were selected randomly around the top of the head for each panelist and were used for the measurement of hair fi ber shape. For 132 panelists from the 230 panelists above, hair diameter was measured with a rotat- ing fi ber diameter system equipped with a laser (Kato Tech Co. Ltd., Kyoto, Japan), at 20°C and 65% relative humidity. The shadow of the hair fi ber was recorded while it was rotated at intervals of 30 degrees, and the orthogonal projection of the hair was measured. The maximum value was taken as the major axis and the minimum value as the minor axis of the hair fi ber. Each fi ber was measured at fi ve positions at intervals of 1 mm along the fi ber, and the mean values of the minor and major axes were calculated. Hair curl radius was measured according to the method reported earlier (9). To remove any temporary water set, which is formed while a hair fi ber dries and is caused by the Figure 1. Evaluation of hair luster. (a) An example of a photograph of the back of the head taken with a digital camera. White rectangle: the area where RGB analysis was performed. (b) Brightness (L) calculated from the RGB data of the area surrounded by the white rectangle in Figure 1a.

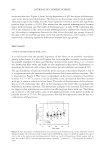
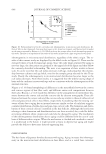
JOURNAL OF COSMETIC SCIENCE 640 exchange of hydrogen bonds, the hair fi bers were immersed in water for 10 min at 25°C and dried on vibrating fi lter paper. By drying in this manner, hair does not have any tension that affects hair fi ber shape. Hair fi bers were put on an image scanner (Epson, Type GT- X800) and sandwiched softly with a bonnet, and then the two-dimensional image of the hair shape was obtained. Through the analysis of the two-dimensional image (9), the curvature at every 1-mm step along the trajectory, from the root along a 15-cm length, was calculated. In the case of the panelists who had had their hair permed, only the hair segment with no history of perming was used for the analysis. On the other hand, hair color hardly affects hair shape, and so the color-treated hairs were used for shape measurements with no distinction. The mean value of the curvature was used as an index of the curliness of the hair fi ber. STRUCTURAL ANALYSIS For 82 panelists randomly selected from the 230 panelists above, two or three hair fi bers were again randomly chosen (total of 187 fi bers) to be analyzed for internal structure by microbeam X-ray scattering at beamline BL40XU of the synchrotron facility SPring-8 (Hyogo, Japan). The quasi-monochromated X-ray beam (ΔE/E ∼ 0.02 X-ray wavelength = 0.083 nm) from the helical undulator (11) was used in this study. An X-ray microbeam with a diameter of 5 μm was obtained by inserting a pinhole of 3-μm diameter 15 cm up- stream of the sample position. The parasitic scattering was removed by the second pin- hole inserted just before the sample position. The sample-to-detector distance and the X-ray exposure time were 1470 mm and 1.2 s, respectively. A cooled CCD, coupled with an X-ray image intensifi er (Hamamatsu Photonics, Shizuoka, Japan), was used as a detec- tor (12). Sample fi bers were set out on a slotted mounting plate, at about 1-mm intervals, and then glued on to the plate at both ends such that the fi bers were fi xed under no ten- sion. The plate was held on the stage so that the fi ber’s axis was perpendicular to the X-ray beam. The sample position, with respect to the X-ray microbeam, was changed in equal steps (5 μm), in the transverse direction of the fi ber. The tilt angle of intermediate fi laments against the fi ber axis was estimated from the full-width value at half maximum (FWHM) of the scattering profi le concerning intermediate fi laments in the azimuthal direction (10,13). P is defi ned as the relative position in the transverse direction from the most convex side (P = 0) to the most concave side (P = 1) of the curl. Scattering data from both regions (0 P 0.2 and 0.8 P 1.0) are possibly affected by the scattering from the cuticle. Thus, the parameter indicating the internal inhomogeneous distribution, η2, is defi ned as the ratio of the averaged value of FWHM in the convex side (0.2 P 0.5) to that in the concave side (0.5 P 0.8). STATISTICS Statistical analyses were performed using regression analysis or Student’s t-test. For scat- ter plots, regression analysis was used to obtain the correlation coeffi cient R and the p-value for the linear slope. For comparisons between values of two decennial age groups, Student’s t-test was used. In both cases, p-values 0.05 were considered statistically signifi cant.
Purchased for the exclusive use of nofirst nolast (unknown)
From: SCC Media Library & Resource Center (library.scconline.org)