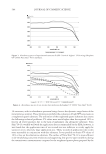
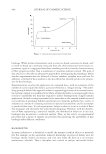
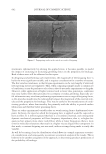
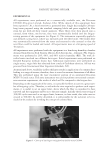
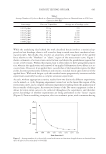
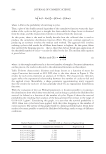
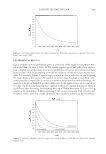
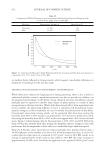
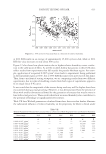
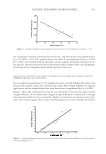
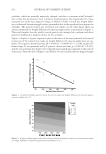
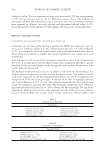
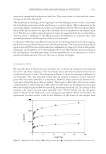
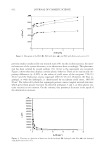
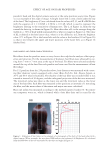
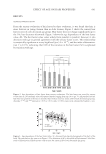
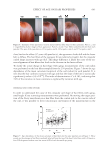
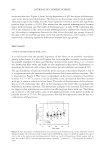
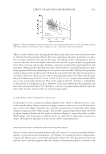
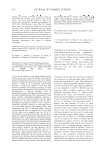
EFFECT OF AGE ON HAIR PROPERTIES 643 clear, but for the oldest (57 years old) panelist (e), the appearance looks dull and the luster belt is diffuse. The hair fi bers of the youngest (b) are relatively straight, but the irregular curled shape increases with age (d,f). This shape difference is likely the cause of the un- even alignment of hair fi bers that leads to the decrease in the luster of hair. To clarify the actual change in hair shape with aging, measurements of the curl radius were performed on the hair fi bers sampled from the 230 panelists. Figure 7 shows the age dependence of the mean curvature (reciprocal of the curl radius) for each panelist. It is seen that the hair curliness increases with age and that the slope of the line is statistically signifi cant (p-value = 9.9 × 10⁻¹²). The index of determination r2 is 0.185, indicating that 19% of the variation in mean curvature is explained by variation with age. INTERNAL STRUCTURE OF HAIR In order to understand the cause of this irregular curl shape of hair fi bers with aging, small-angle X-ray scattering measurements were performed. By moving the target posi- tion of the X-ray microbeam on a hair fi ber from the convex side to the concave side of the curl, it was possible to detect microscopic unevenness of the nanostructure in the Figure 6. Examples of hair appearance (sensory luster) and hair fi ber shape for three panelists. Parts a, c, and e: magnifi ed back-shot images of hair appearance. Parts b, d, and f: hair fi bers randomly selected from each panelist. The ages of the panelists are 25 for parts a and b, 40 for parts c and d, and 57 for parts e and f. Figure 7. Age dependence of the mean curvature of hair fi bers for the same panelists an in Figure 3. These points are the averages of ten fi bers randomly selected from the top of the head. Solid line: result of lineariza- tion. Filled squares with an error bar: mean ± SD of each decennial age group.

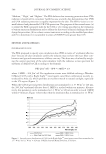
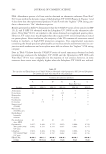
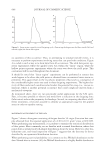
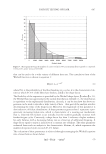
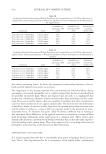
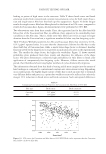
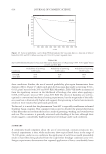
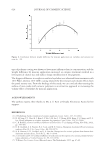
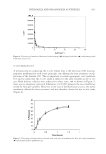
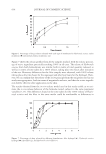
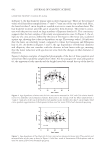
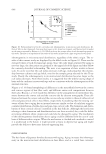
JOURNAL OF COSMETIC SCIENCE 644 transverse direction. Figure 8 shows the age dependence of η2, the degree of inhomoge- neity in microstructural distribution. These points are the average value for each panelist. Data points again vary widely, but the linear regression line has a statistically signifi cant positive slope (p-value = 0.030). This means that the internal inhomogeneity becomes larger with increasing age. The index of determination r2 is only 0.058, indicating that 6% of the variation in the cross-sectional inhomogeneity is explained by variation with age. According to comparisons between the data of two decennial age groups, however, the data of the 10s and 60s and those of the 20s and 60s showed p = 0.021 and p = 0.011, respectively, indicating signifi cant differences between these age groups. DISCUSSION CAUSE OF LUSTER DECREASE WITH AGING It is well known that the parallel alignment of hair fi bers of an assembly contributes greatly to hair luster. It is also well known that increasing fi ber curvature interferes with the parallel alignment of hairs and therefore decreases hair luster. Keis et al. (15) have also shown that fi ber twists and kinks are also important to hair luster. Furthermore, to determine the luster of curly or frizzy hair tresses special techniques are required (16). The age dependence of hair luster and the mean curvature of hair fi bers (Figures 3 and 7) is in agreement with the known relationship between hair luster and hair curvature. This is illustrated in Figure 9. Hair luster is dependent on the mean curvature of hair fi bers (p-value = 6.7 × 10⁻¹¹), and so it can be said that as the curvature of the fi ber increases with age, it causes a reduction in hair luster. The index of determination of this relation- ship is 0.176, indicating that 18 % of the variation in the luster (ΔL) is explained by variation in the mean curvature. The data points in Figure 9 are scattered. This data scat- ter suggests that other factors are involved in affecting hair luster with age. The lifting up of cuticles at the hair surface, gray or less-pigmented hairs, and a porous medulla are possible reasons (1,17–19). For aged persons, the dull hair appearance may be due to a combination of these factors. Figure 8. Age dependence of inhomogeneity in microstructural distribution,η2, for 82 randomly selected Japanese females. η2 is the ratio of the averaged value of FWHM that relates to the IF tilt angle in the convex side to that in the concave side (see Experimental). Solid line: result of linearization. Filled squares with an error bar: mean ± SD of each decennial age group. Asterisks * represent p 0.05 obtained by Student’s t-test.
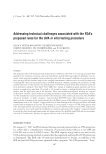
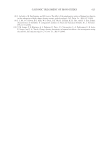
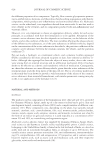
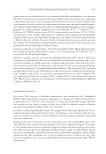
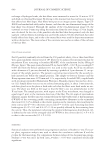
Purchased for the exclusive use of nofirst nolast (unknown)
From: SCC Media Library & Resource Center (library.scconline.org)