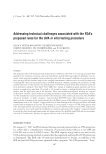
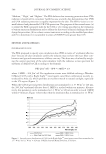
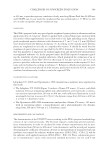
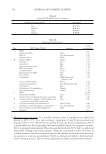
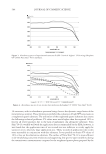
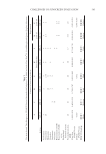
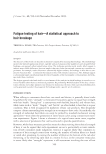
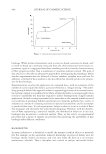
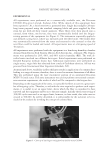
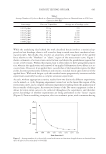
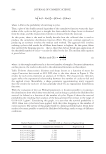
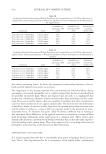
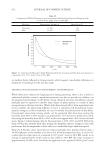
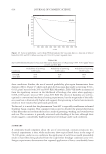
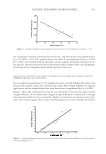
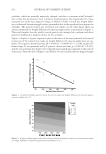
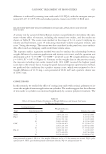
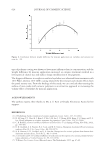
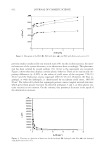
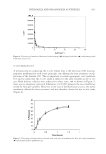
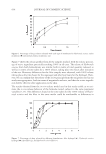
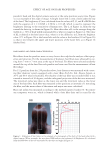
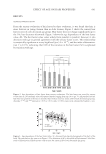
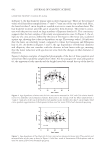
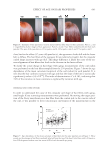
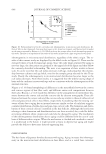
FATIGUE TESTING OF HAIR 605 While the underlying idea behind the work described herein involves a statistical ap- proach to hair breakage, there is still a need to keep in mind some basic mechanical test- ing principles. Specifi cally, this involves an awareness of the magnitude of the applied force relative to the “Hookean” or “elastic” region of the stress-strain curve. Figure 1 shows a schematic of a stress-strain curve for hair, and shows the pseudolinear region that occurs at low strains. Within this region, hair is often taken to have spring-like proper- ties, wherein the application and removal of an applied deformation leaves fi bers in a re- covered state. However, if an applied force exceeds that of the linear-like region, the fi ber yields, becomes permanently deformed, and retains a residual strain upon removal of the applied force. With each fatigue cycle this residual strain progressively increases and the experiment essentially becomes a complex extension experiment. As such, without appropriate scrutiny, results from two distinctly different experiments can be mixed—a cyclic fatiguing experiment carried out in the linear-like region of the stress-strain curve, and a complex extension experiment resulting from the application of forces outside of this region. An attractive feature of the Dia-stron equipment is that it allows for stress-strain curves to be collected throughout the experiment, and therefore proves knowledge of whether experiments are being performed in the “linear” region (Figure 6). From a modeling viewpoint, this is an academic point, with consumers having Table I Average Number of Cycles-to-Break as a Function of Fatiguing Stress as Obtained from an S-N Curve Created at 60% RH Stress range Force on 70-μm fi ber Average no. of breakage cycles 0.0145 g/μm2 55.8 g 370 0.0135 g/μm2 52.0 g 920 0.0125 g/μm2 48.1 g 2,300 0.0115 g/μm2 44.3 g 5,700 0.0105 g/μm2 40.4 g 14,100 0.0095 g/μm2 36.6 g 35,100 0.0085 g/μm2 32.7 g 87,300 Figure 5. Average number of cycles-to-fail versus break stress as a function of applied stress as obtained from the S-N plot for Caucasian hair at 60% RH.

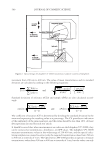
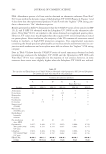
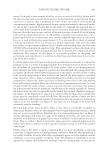
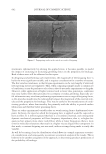
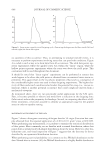
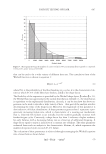
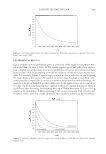
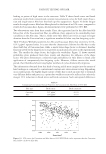
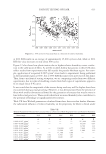
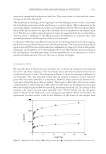
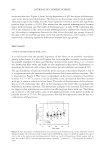
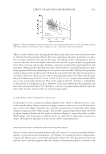
JOURNAL OF COSMETIC SCIENCE 606 no awareness of this occurrence. Thus, in attempting to simulate real-life events, it is necessary to perform experiments involving stress that can span both conditions. Figure 4 is coded in such a way as to show data from all occurrences. The solid data points rep- resent experiments where the applied stress was within the “linear” region, while the hollow points represent experiments where the stress was above the yield point. This convention will be used throughout this document. It should be noted that “linear region” experiments can be performed at stresses that would appear to be above the yield point as obtained from conventional stress-strain ex- periments. This again relates to the viscoelastic properties of hair and is a consequence of the considerably higher strain rate used in these fatiguing experiments. The higher elas- ticity of fi bers under such conditions also hinders the potential for creep (i.e., viscous re- laxation), which is another potential occurrence that could complicate matters from a mechanical viewpoint. As mentioned above, there are two potentially useful applications for the S-N curve. First, it becomes possible to observe and model how a reduction in the fatiguing force (lubrication) reduces the propensity for breakage. Second, in comparing the effects of dif- ferent treatments, it becomes possible to identify an appropriate range for the applied stress in order to expedite testing. MATHEMATICAL TREATMENT OF THE DATA Figure 7 shows a histogram consisting of fatigue data for 50 virgin Caucasian hair sam- ples obtained from the repeated application of a 0.010–0.011 g/um2 stress at 60% RH. When performing any measurement, it is prudent to examine the statistical distribution of data points. Most commonly, we are familiar with a normal distribution, where data points form a symmetrical bell-shaped distribution about the mean. However, other dis- tributions exist, and visual inspection of Figure 7 suggests that the data may be better described by an exponential distribution function. When performing survival probability it is common to fi t a Weibull distribution to the data. Named after its inventor (10), the Weibull distribution is a highly fl exible distribution Figure 6. Stress-strain curves for initial fatiguing cycle, illustrating the shapes seen for fi bers inside (left) and outside (right) the linear-like region.
Purchased for the exclusive use of nofirst nolast (unknown)
From: SCC Media Library & Resource Center (library.scconline.org)