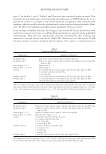
JOURNAL OF COSMETIC SCIENCE 16 neutrals calibration curve following the same preparation for HPLC analysis as the sam- ples, with the exclusion of the internal standard. Once the citrulline concentration was validated, a calibration curve for the samples was generated using amino acid standard H, as seen in Table I. AABA internal standard stock solution was prepared by weighing 2.5 mg of AABA into 10 ml of 10 mM HCl. Two milliliters of this solution was diluted to 50 ml with a further 10 mM of HCl. All stock solutions were stored refrigerated until use. Quantitation of NMF. The tapes were extracted with 300 μl of 6mM perchloric acid spiked with 10 μl of 2 μmol/ml α-amino-n-butyric acid (AABA) at room temperature for three hours. After three hours, the extract was removed by micropipette to a fresh microcentri- fuge tube, while the tape was reserved in the original tube for protein analysis. For HPLC analysis, 20 μl of extract and 30 μl of 0.2 M sodium borate buffer, pH 8.8, were added to HPLC microvials, derivatized with 10 μl of AccQ-Fluor for fl uorescence detection, and vortexed for fi ve seconds. Samples were analyzed using the AccQ-Tag system (Waters Corp.) with gradient elution (Eluent A: Waters AccQ-Tag Eluent A [one part to ten parts deionized water] Eluent B: 45% ACN, 15% MeOH, 40% H 2 O [w/w] see Table II) on a C-18 reverse-phase column (25-cm length, 4.6-mm internal diameter). The excitation wavelength was 250 nm with emission at 395 nm. The column temperature was 40° C with a run time of 40 minutes. The HPLC results were standardized to the amount of protein removed by the individual tape using the Pierce BCA protein assay (14). After NMF extraction, the tapes were re- extracted using a solution of 300 mM urea + 2% w/w sodium lauryl sulfate. Three hun- dred microliters of this solution was added to each microcentrifuge tube and vortexed for one minute before being refrigerated overnight. The following morning, the samples were warmed back to room temperature, placed in a 60° C water bath for 30 minutes, sonicated for six minutes, then vortexed again for one minute. At this point, the spent tapes were discarded. A 96-well plate was fi lled, in triplicate, with 25 μl of this protein extract and 200 μl of Pierce working reagent in each well. A calibration curve with con- centrations of 6.25, 12.5, 25, 50, 100, 200, and 400 μg/ml was prepared by serial dilu- tion of an 800-μg/ml BSA stock solution (in water). The plates were incubated at 37°C for one hour, and then read on a spectrophotometer at 562 nm. BIOPHYSICAL INSTRUMENTATION Transepidermal water loss (TEWL, g/m2/hr) was determined using a DermaLab evapo- rimeter (Cortex Technology, Denmark). The rate of moisture accumulation (MAT, cru/sec) Table I HPLC Standard Curve Preparation Amounts Target concentration AA standard H Citrulline stock 10 mM HCI 12.5 nM/ml 5 μl 5 μl 990 μl 25 nM/ml 10 μl 10 μl 980 μl 50 nM/ml 20 μl 20 μl 960 μl 75 nM/ml 30 μl 30 μl 940 μl 100 nM/ml 40 μl 40 μl 920 μl 250 nM/ml 100 μl 100 μl 800 μl 500 nM/ml 200 μl 200 μl 600 μl

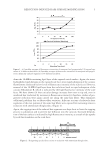
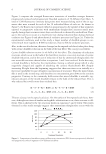
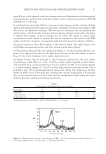
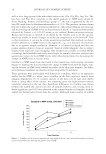
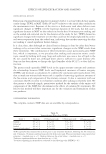
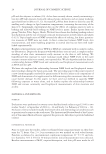
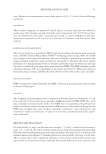
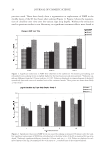
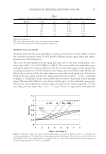
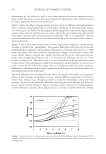
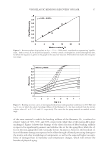
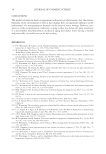
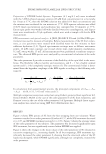
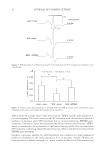
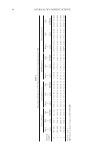
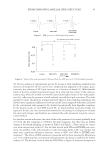
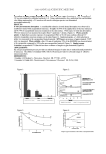
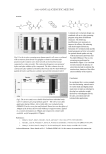
EFFECTS OF LIPID EXTRACTION AND SOAKING 17 was measured with a NOVA® Dermal Phase Meter 9003 (NOVA® Technology, Ports- mouth, NH). The MAT uses changes in skin capacitive resistance (the ratio of charge to potential on an electrically charged isolated conductor) under occlusion by the probe to determine the extent of skin hydration (15). Transepidermal water accumulates under the sensor for twenty seconds and the value is calculated as the slope of the regression line (cru/s). The MAT method provides a dynamic measure of SC water handling, as previ- ously reported (16). STATISTICS All data were examined using univariate GLM measures in SPSS (SPSS, Inc.). Prior to analysis, log 10 transformation of the NMF data was used to improve the normality of the data sets. The statistical assessment for the NMF data included tape number, treatment, treatment * tape number (interaction), and treatment * subject (interaction). MAT and TEWL are reported as estimates ± confi dence intervals. The model for analysis of the bio- physical data included treatment, panelist, baseline TEWL, and baseline TEWL * treat- ment (interaction). A value of p 0.05 was considered statistically signifi cant. Treatments were compared using analysis of variance (ANOVA, p 0.05, SigmaStat, SPSS, Inc.), and pairwise comparisons were made with the appropriate procedure (Tukey, Dunn, p 0.05). RESULTS AND DISCUSSION UNTREATED CONTROL AND EFFECTS OF DEPTH A signifi cant increase in NMF levels corresponding to an increase in SC depth (as tape strip number) was found for tape strips 1, 3, and 5 for the untreated control. Tapes 10 and 15 were not signifi cantly different from tape 5 and are not further discussed. This increase was found to be signifi cant for the summed amino acids, as Table II HPLC Gradient Time (min) Flow (ml/min) % Eluent A % Eluent B Curve 0.00 1.0 98 2 15.00 1.0 93 7 6 16.00 1.0 87 13 6 27.00 1.0 68 32 6 30.00 1.0 68 32 6 31.00 1.0 0 100 6 37.00 1.0 0 100 6 38.00 1.5 98 2 6 40.50 1.5 98 2 6 41.00 1.0 98 2 6 50.00 1.0 98 2 6 60.00 1.0 0 100 6 100.00 0.0 0 100 11 Curve type 6 represents a linear change of solvent concentration over the time period. Curve type 11 is an immediate change of conditions.
Purchased for the exclusive use of nofirst nolast (unknown)
From: SCC Media Library & Resource Center (library.scconline.org)