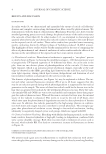
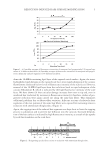
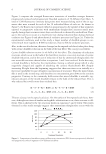
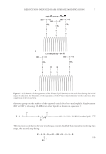
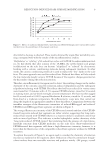
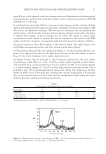
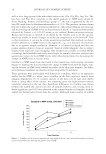
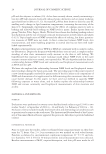
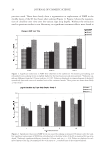
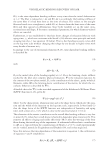
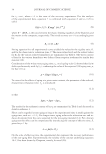
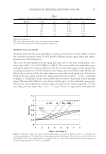
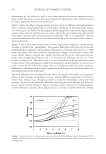
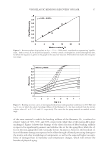
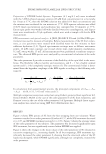
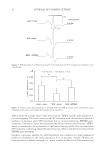
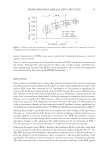
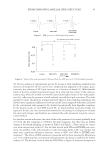
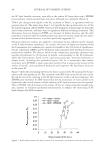
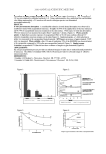
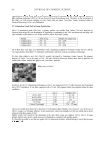
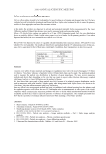
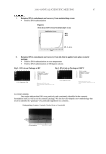
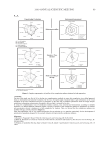
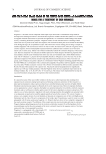
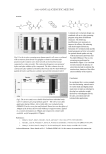
EPDME IMPROVES LAMELLAR LIPID STRUCTURE 41 Preparation of EPDME-loaded liposomes. Liposomes (0.5 mg/0.5 ml) were incubated with the 5-DSA ethanol-aqueous solution (26 μM fi nal concentration) in a microtube for 1 hour at 37°C then the EPDME solution was added (1% fi nal concentration) and the mixture was incubated for ten minutes at 37°C. SDS aqueous solution was added (0.02% fi nal concentration) and incubation was continued for 30 minutes at 37°C. Excess spin probe was washed off with distilled water by centrifugation, and disper- sions were transferred to 50 μl capillaries, which were used as sample cells for the EPR measurement. EPR measurements and spectral analysis. A JEOL JES-RE1X X-band (9 GHz) EPR spec- trometer was used to measure all samples. Before measurements of the SC from volun- teers, ex vivo specimens were treated with distilled water for fi ve minutes to have suffi cient hydration (3,4). Typical spectrometer settings were as follows: microwave power, 10 mW time constant, one second sweep time, eight minutes modulation, 0.2 mT sweep width, 15 mT. All measurements were performed at ambient tempera- ture. The obtained EPR spectra were analyzed by conventional calculation of the order parameter. The order parameter S provides a measure of the fl exibility of the spin label in the mem- brane. The fl exibility refl ects motility and orientation, and S = 1 for a highly ordered system and S = 0 for completely isotropic motion (5). The conventional S value is deter- mined from the hyperfi ne couplings of the EPR signals according to the following rela- tions (6): A A c 2A . , , . 1 3 3 ( ) 2 II II XX YY ZZ zz XX A A a A A A A S a a ac A A AYY In calculation from experimental spectra, the principal components of (AXX + AYY + AZZ) = (0.66, 0.55, 3.45) mT were used (7). Multiple comparison assays were carried out using Fisher’s protected least signifi cant dif- ference (Fisher’s PLSD) in the case of the order parameter S of SC from volunteers, and Dunnett’s test in the case of the order parameter S of liposomes. Multiple linear regres- sion analysis was carried out using JMP Ver.6 (SAS Institute Inc.). RESULTS Figure 2 shows EPR spectra of SC from the fi rst stripping from one volunteer. Water treatment resulted in an order parameter (S) value of 0.57, while SDS treatment decreased it to 0.53 and EPDME treatment restored it to 0.56. Figure 3 shows the average values of the order parameter of ten subjects. The parameter was decreased signifi cantly upon SDS treatment, but was signifi cantly restored when EPDME was applied. Figure 4 shows the changes in the mean values of the order parameter of SC obtained in successive strippings (i.e., increasing depth). In all four strippings, SDS treatment sig- nifi cantly decreased the order parameter S, showing that the structural order of the SC lipids was disrupted, while EPDME signifi cantly, although not completely, restored the order parameter.

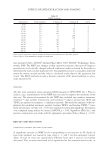
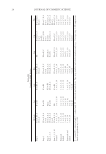
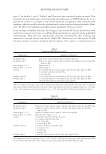
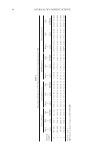
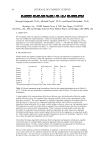
JOURNAL OF COSMETIC SCIENCE 42 Table I shows the average values of the water content, TEWL, and the order parameter S, for each stripping. The water content in the SC, measured with a Corneometer, showed a tendency to decrease upon SDS treatment but to increase following EPDME post- treatment. The water content measured with the Skicon showed similar results. TEWL, which is considered to be a parameter of the barrier function of the skin, increased after SDS treatment, indicating impaired barrier function, while it tended to be reduced with EPDME post-treatment. Stepwise regression analysis by null hypothesis was conducted to find influential predictor valiable(s) to the order parameter S as an outcome variable. Within the three predictor valiables analyzed, i.e., water content by Skicon or Corneometer and Figure 2. EPR spectrum of 5-DSA incorporated into SC lipids from the fi rst stripping of a volunteer’s mid- volar forearm. Figure 3. Values of the order parameter S obtained from the EPR spectrum of SC removed by single strippings with cyanoacrylate from the forearms of ten volunteers.
Purchased for the exclusive use of nofirst nolast (unknown)
From: SCC Media Library & Resource Center (library.scconline.org)