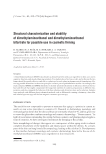
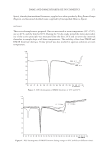
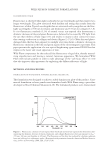
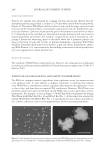
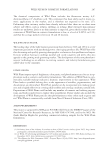
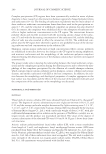
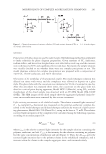
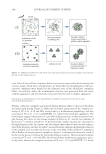
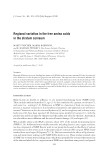
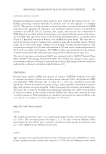
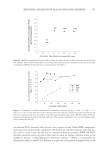
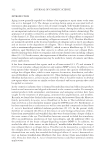
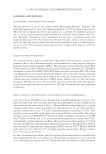
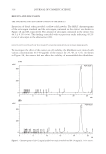
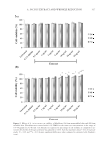
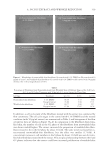
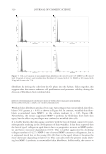
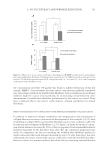
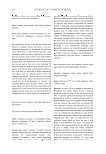
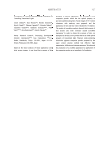
MORPHOLOGY OF COMPLEX AGGREGATES IN SHAMPOOS 291 METHODS Preparations of the phase diagrams and the model shampoo. The following method was performed to make solutions for phase diagram preparation. Given amounts of CC, surfactant, sodium sulfate, and water were weighed into a test tube with a screw cap, and the contents were well mixed at 60°C and equilibrated for several days. Afterward, the sample solution was visually checked to see whether there were any complex precipitates or not. The model shampoo solution for complex precipitation was prepared with a composition of 1wt% CC, 15wt% surfactant, and 3wt% electrolyte. Observations of the morphology of the precipitated complex. The model shampoo solution was diluted ten times with water, and the complexes were allowed to deposit on a glass slide. The glass slide with the coacervate was immersed in 50 ml of acetone for one day. After this procedure was repeated three times, the coacervate on the glass slide was dried in a critical point drying apparatus, Model HCP-2 (Hitachi), using CO2, and the morphology of the dried sample was observed with an FE-SEM Model JSM-6300F (JOEL). The SEM images of the dried sample show the aggregated polymer chains be- cause excess surfactants were removed by the acetone treatment. Light-scattering measurements on the solubilized complex. The relative scattered light intensity I (I = I90 (sample)/I 90 (benzene)) was measured on the polymer–surfactant complex dis- solved in the model shampoo and diluted shampoo solutions by means of a light-scatter- ing photometer, Model DLS-700 (Photal Co.), using an Ar laser at 75 mW. The relative scattered light intensities of the complexes were calculated using the following equation, according to an earlier paper (19): complex whole micelle I I I c = ' (1) where Iwhole is the relative scattered light intensity for the sample solution containing the polymer, surfactant, and salt. I′micelle is the intensity for the solution containing no polymer but the same concentrations of surfactant and salt (Figure 2). Then, the Δ Icomplex gives the scattered light intensity due to the polymer chains in the solubilized complexes, and it increases when the chains in the complex aggregate intra- and intermolecularly. Figure 1. Chemical structures of cationic cellulose (CC) and cationic dextran (CD). m = 2~3. α is the degree of cationic substitution.

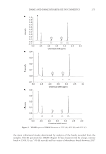
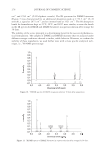
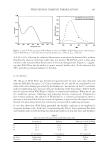
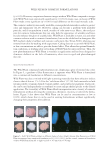
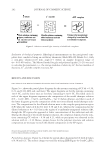
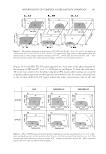
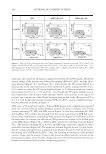
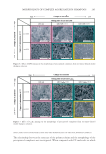
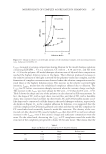
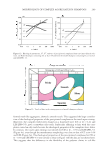
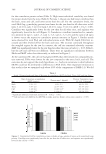
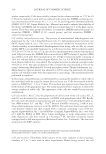
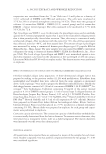
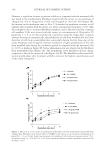
JOURNAL OF COSMETIC SCIENCE 292 Evaluation of rheological properties. Rheological measurements on the precipitated com- plexes were conducted using an oscillatory rheometer, Model RS-100 (Haake Co.), with a corn-plate (diameter=20 mm, angle=1°) within an angular frequency range of ω = 0.05-650 rad/sec. The Maxwell model for gels and polymer liquids (21–23) was used to calculate the parameters, i.e., the storage modulus of elasticity, G′, the loss modulus of elasticity, G′′, and the complex vis cosity, η*. RESULTS AND DISCUSSION DILUTION OF THE MODEL SHAMPOO SOLUTION AND COACERVATION OF THE COMPLEX Figure 3a–c shows the partial phase diagrams for the systems consisting of CC (α = 0.38, 0.21, and 0.10), LES, salt, and water. The upper diagrams are for the systems containing 1wt% CC, and the lower ones are for those containing 0.1wt% CC. The fi lled circle in each of the upper diagrams represents the composition of the model shampoo solution (CC = 1wt%, LES = 15wt%, and Na2SO4 = 3wt %) before dilution, and that in each of the lower diagrams gives the composition of the ten-times-diluted model shampoo solu- tion. The compositions for the diluted solution were in the complex precipitation region (CP) when the values of α for CC were 0.38 and 0.21, whereas the composition for the diluted solution at α = 0.10 lay in the region of a uniformly transparent solution (1ϕ), though the CP region also appeared at lower concentrations of the surfactant and salt. During the dilution of the model shampoo solution, the complexes deposited in the solu- tions containing CC with α = 0.38 and 0.21, while no precipitate was observed in the solution with α = 0.10. Hence, proper choices for the polymer structure and solution composition are necessary to reach the diluted composition in the CP region. PHASE DIAGRAMS BY MIXING SURFACTANTS AND THE MORPHOLOGY OF THE PRECIPITATED COMPLEX Partial phase diagrams. Figure 4a–f shows the partial phase diagrams for CC with α values of 0.38 and 0.21. The anionic charge was varied by mixing LEB (Figure 4a–f) and C18EO25 Figure 2. Relative scattered light intensity of solubilized complexes.
Purchased for the exclusive use of nofirst nolast (unknown)
From: SCC Media Library & Resource Center (library.scconline.org)