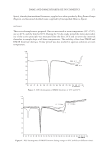
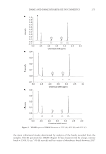
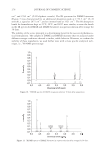
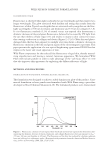
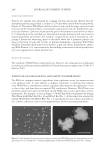
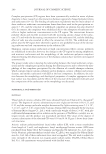
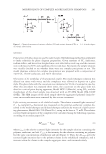
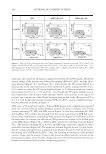
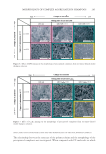
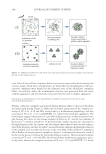
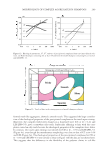
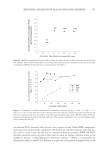
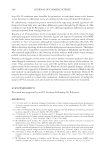
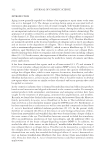
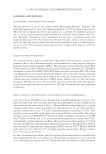
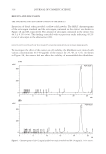
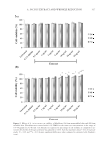
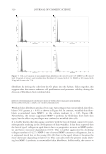
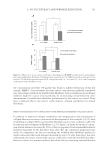
MORPHOLOGY OF COMPLEX AGGREGATES IN SHAMPOOS 293 (Figure 5a–f) with LES. The CP region appeared in a wide zone of the phase diagram for the mixture of LES and CC at α = 0.38 (Figure 4a and Figure 5a show the same data). This zone was connected to the phase separation (PS) region where salting out occurred to produce phase separation on the high salt concentration side. In contrast, the reduction in the α value shifted the CP region toward the lower concentration side of salt and Figure 3. Partial phase diagrams in the presence of CC, LES, and Na2SO4. In (a), (b), and (c), the degrees of cationization for CC are α=0.38, α=0.21, and α=0.10, respectively. The arrows in these fi gures show the dilution process of the sample solution containing 1wt% CC, 15wt% LES, and 3wt% Na2SO4. (CP = com- plex precipitation region, PS = phase separation region, and 1ϕ = clear one-phase solution.) Figure 4. Effect of LPB mixing on the partial phase diagrams for systems containing CC at 0.1 wt%, surfac- tant, and Na2SO4 as salt. (a), (b), and (c) are for CC at α = 0.38 (d), (e), and (f) are for CC at α = 0.21. The mixing ratio of the surfactant is given by weight. (CP = complex precipitation region, PS = phase separation region, and 1ϕ = clear one-phase solution region.)

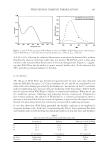
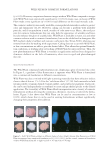
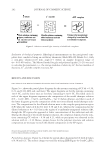
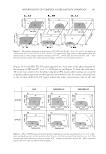
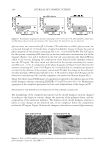
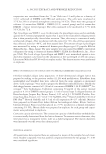
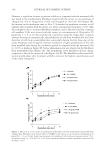
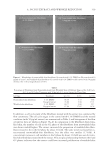
JOURNAL OF COSMETIC SCIENCE 294 surfactant, and caused the 1ϕ region to appear between the CP and PS regions. While the anionic charge of the micelles was lowered by mixing LPB and C18EO25 and the 1ϕ re- gion widened (Figure 4b,c and Figure 5b,c, respectively), the CP region shifted to a small extent on the concentration axis of the surfactant. C18EO25 mixing with CC at α = 0.21 tended to widen the CP region slightly (Figure 5e,f). Dilution produced complex precipitation for CC at α = 0.38 and 0.21, even though the CP region shifted, because the composition of the diluted model shampoo (fi lled circle) still lay in the region. In contrast, the composition of the diluted shampoo solution was in the 1ϕ region for CC at α = 0.1, even though the solution contained LPB or C18EO25, and no complex precipita- tion was observed, as shown in Figure 3c. SEM images of the precipitated complexes. Typical SEM images of the complexes precipitated from the ten-times-diluted model shampoo solution are shown in Figure 6a–f for the system containing CC, LES, and LPB, and in Figure 7a–f for that containing CC, LES, and C18EO25. The complex precipitated from the system containing no LPB had a uni- formly dense membranous morphology when α was 0.38 (Figure 6a and Figure 7a show the same data). In contrast, the addition of LPB produced an increase in the hollow parts in the SEM images (Figure 6b,c), while C18EO25 produced a network structure (Figure 7b,c). The system containing CC at α = 0.21 and LES alone caused the complex to form a mesh-like structure (Figure 6d). The mesh size widened (Figures 6e and 7e), and eventu- ally the complex precipitated in a dispersed state (Figures 6f and 7f), with an increase in the mixing ratio of LPB and C18EO25. Thus, the lowering of the degree of the polymer cationic charge and the anionic charge in the mixed micelles made the structure of the precipitated complex looser. Further charge reductions of both the polymer and the sur- factant micelles prevented secondary complex aggregation. Figure 5. Effect of C18E25 mixing on the partial phase diagrams for systems containing CC at 0.1wt%, sur- factant, and Na2SO4 as salt. (a), (b), and (c) are for CC at α = 0.38 (d), (e), and (f), are for CC at α = 0.21. The mixing ratio of the surfactant is shown by weight. (CP = complex precipitation region, PS = phase separation region, and 1ϕ = clear one-phase solution region.)
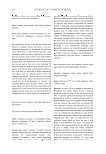
Purchased for the exclusive use of nofirst nolast (unknown)
From: SCC Media Library & Resource Center (library.scconline.org)