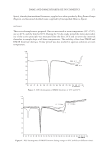
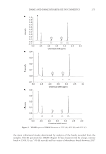
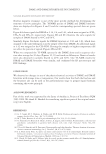
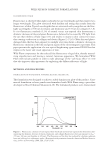
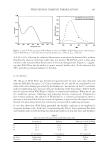
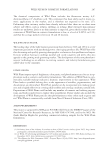
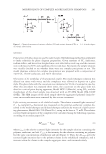
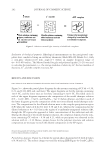
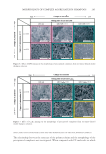
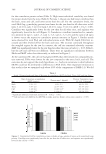
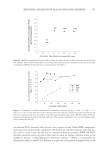
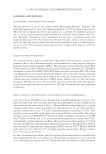
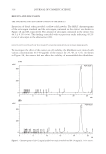
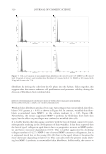
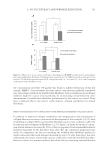
DMAE AND DMAE BITARTRATE IN COSMETICS 275 Figure 9. 1 HNMR spectra of DMAE bitartrate at 25°C (A), 40°C (B), and 60°C (C). the main vibrational modes determined by analysis of the bands recorded from the samples. The IR spectrum for DMAE (Figure 6) was characterized by a large, intense band at 3368.31 cm−1 (O–H stretch) and by a series of absorbance bands between 2947

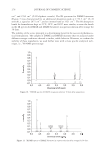
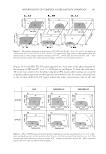
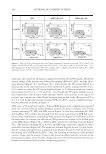
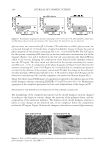
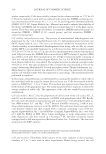
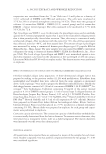
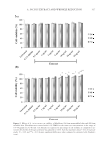
JOURNAL OF COSMETIC SCIENCE 276 cm−1 and 2782 cm−1 (C–H aliphatic stretch). The IR spectrum for DMAE bitartrate (Figure 7) was characterized by an additional absorption peak at 1732.3 cm−1 (C=O stretch), a signal at 2975 cm−1, and an intense band at 3321 cm−1. The IR absorption bands for formulations kept at 25°C, 40°C, and 60°C were similar, as were the bands in the IR spectra for DMAE and DMAE bitartrate in aqueous solution after storage for 30 days. The stability of the active principle is a determining factor for the success of pharmaceu- tical formulations. The samples of DMAE and DMAE bitartrate that we analyzed under different storage conditions showed a similar, stable behavior. However, to confi rm the stability of these ingredients, we used further tests with a more specifi c analytical tech- nique, i.e., 1 H-NMR spectroscopy. Figure 10. 1 HNMR spectra of DMAE in aqueous solution 30 days after preparation. Figure 11. 1 HNMR spectra of DMAE bitartrate in aqueous solution after storage for 30 days.
Purchased for the exclusive use of nofirst nolast (unknown)
From: SCC Media Library & Resource Center (library.scconline.org)