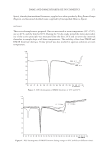
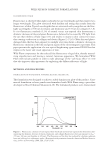
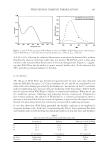
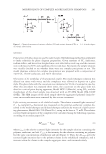
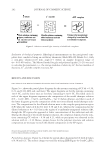
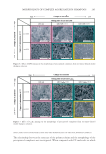
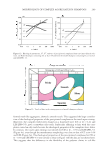
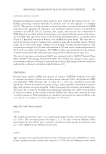
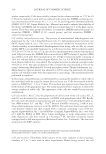
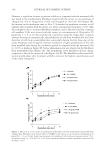
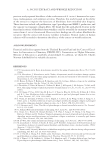
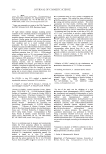
JOURNAL OF COSMETIC SCIENCE 304 the existence of a gradient in NMF levels over the depth of the stratum corneum. Since the skin varies widely over the body surface in appearance, hydration, and biophysical prop- erties (9), we hypothesized that some of these differences may arise from differences in the chemical makeup of the skin, such as FAA quantities. Our aim was to determine whether a relationship exists between FAA and skin hydration as a function of body site. METHOD Portions of this method have been published previously (7,8). Skin surface samples (using D-Squames® tapes) were collected, and biophysical measurements were made during two studies conducted during winter: forearm and calf (Study 1) and jaw, back, torso, and calf (Study 2). Figure 1 shows the locations of sample collection. Nineteen healthy female subjects (aged 23–60) were enrolled in Study 1 and fi fteen in Study 2. Exclusion criteria included visually dry forearm skin and dermatological conditions such as psoriasis, rosacea, atopic der- matitis, and acne in the study areas. The Institutional Review Board of the University of Cincinnati Medical Center approved the protocols, and the subjects provided informed consent prior to inclusion in the study. No washing restrictions were imposed during Study 1, but moisturizer use was discontinued on the legs two weeks before measurement collection. During Study 2, the panelists did not use moisturizers on the day of sample collection. Fifteen tapes were serially collected from each site. The tapes were stored at −80°C until analysis. Figure 1. Locations of the body site hydration (MAT) measurements and collection of samples for FAA determination.

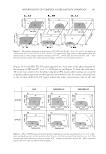
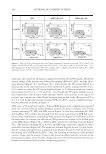
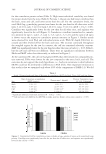
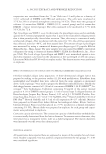
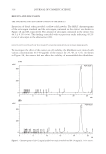
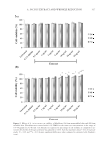
REGIONAL VARIATION IN FAAs IN STRATUM CORNEUM 305 RATIONALE AND FAA ANALYSIS Filaggrin deimination and proteolysis produces most of the SC free amino acids (15–17). Further processing converts histidine to urocanic acid (4) and arginine to citrulline (18,19). The presence of high urocanic acid and citrulline concentrations indicates NMF formation from fi laggrin (4). Glutamic acid undergoes further reaction to pyrrolidone carboxylic acid (PCA) (20,21). Lactates, urea, sugars, and ions are also components of NMF. Based on available analytical techniques, we evaluated the free amino acid compo- nent of NMF. The tapes were extracted with 300 μl of 6mM perchloric acid spiked with 10 μl of 2 μmol/ml α-amino-n-butyric acid (AABA) for three hours. The tape was re- served for protein analysis. Samples were analyzed using the AccQ-Tag system (Waters Corp.) on a C-18 reverse-phase column (25-cm length, 4.6-mm internal diameter). The excitation wavelength was 250 nm with emission at 395 nm, and a column temperature of 40°C with a run time of 40 minutes. The HPLC results were standardized to the amount of protein removed by the individual tape using the Pierce BCA protein assay (22). The rate of moisture accumulation (MAT) was measured with a NOVA® Dermal Phase Meter (NOVA® Technology, Portsmouth, NH). The method uses changes in skin capaci- tive resistance (the ratio of charge to potential on an electrically charged isolated conductor) under probe occlusion to determine skin hydration (23). STATISTICS General linear models (GLM) and analysis of variance (ANOVA) methods were used to evaluate the effects of body site on the protein removed, FAA, and hydration (SPSS and SigmaStat, SPSS, Chicago, IL). A value of p 0.05 was considered statistically signifi cant. Amino acid values are given as log10 values (pmoles) normalized to protein (μg), and proteins are given as μg/ml. Values are reported as estimates plus/minus stan- dard error. To account for the high inter-individual variability, the subject was included as a factor/covariate in the statistical model (GLM). Site effects were assessed for tape 1 and for cumulative FAA normalized to cumulative protein for the sums as follows: sum 1+3, sum 1+3+5, sum 1+3+5+10, and sum 1+3+5+10+15. RESULTS AND DISCUSSION STUDY 1 The soluble protein from tape 1 was signifi cantly higher for the calf versus the forearm ( p 0.05). The cumulative protein for tapes 1, 3, 5, 10, and 15 was not different. FAAs were higher for the calf for tape 1 and the cumulative values except for glutamic acid ( p 0.05). MAT was not different for the sites. STUDY 2 Tape 1 protein was signifi cantly lower for the calf versus the torso (ANOVA on ranks, Dunn’s method post hoc versus torso control, p = 0.02). No site differences were noted
Purchased for the exclusive use of nofirst nolast (unknown)
From: SCC Media Library & Resource Center (library.scconline.org)