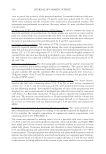
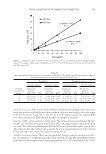
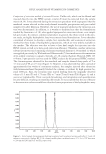
HPLC ANALYSIS OF VITAMIN E IN COSMETICS 355 METHODS Preparation of stock and working solutions. Stock solutions of T and TA in methanol (100– 500 μg/ml) were prepared in amber glass vials and kept refrigerated. The stock solutions were used to prepare standard solutions of T and TA in methanol, covering a concentra- tion range of 1–50 μg/ml. HPLC method. The proposed method involved a Waters 2690 HPLC (Waters 2690 Sepra- tions Module, Milford, MA) with a variable wavelength PDA detector, a disposable C-18 guard column, and an RP Waters Symmetry C-18 column (4.6 ratio × 150-mm, 5-μm particle size). The column temperature was maintained at 25°C. A series of drug solu- tions with a concentration range of 1–25 μg/ml, prepared as described above, was fi lled into sample tubes and loaded into the auto-injection chamber of the HPLC system. The system was programmed to inject each of the samples (50 μl) at a fl ow rate of 1.5 ml/min. The eluents were monitored at 290 nm and 283 nm for T and TA, respectively. The peak areas for T and TA were recorded, and analyzed using the Millennium Software Empower from Waters. The peak areas of T and TA were subjected to regression analysis against their concentrations. Method development. Initial trial experiments were conducted, in a view to select a suitable solvent system for the accurate estimation of the vitamin and to achieve good resolution between T and TA. The suitability of the mobile phase was decided on the basis of the sensitivity of the assay, the suitability for stability studies, the time required for the analysis, ease of preparation, and the use of readily available cost-effective solvents. These included acetonitrile-methanol (95:5 %v/v), acetonitrile (100 %v/v), methanol-water (70:30 %v/v), acetonitrile-water (90:10 %v/v), and methanol-water (97:3 %v/v). A mobile phase system comprising of methanol-water (97:3 %v/v) was found to be optimum, based on retention time, peak symmetry, and resolution. Method validation (a) Linearity. A series of standard curves was prepared over a concentration range of 5–50 μg/ml from a stock solution (500 μg/ml) in methanol. Dilutions were prepared in meth- anol too. The data of peak area versus drug concentration were treated by linear least- square regression analysis. The standard curves were evaluated for intraday and interday reproducibility. (b) Precision. The three components of precision, i.e., repeatability, intermediate preci- sion, and reproducibility, in accordance with ICH recommendations (11), were deter- mined as follows: • Repeatability. Five injections containing a mixture of T and TA (10 μg/ml each) were analyzed and %RSD was calculated for injection repeatability. • Intraday variation. Measurement of intraday variation of T and TA at three different concentrations (5, 10, and 25 μg/ml) was done by injecting the samples on the same day at different time intervals. • Intermediate precision (interday variation). Measurement of interday variation of T and TA mix solutions at three different concentrations (5, 10, and 25 μg/ml) on fi ve consecu- tive days determined the intermediate precision. (c) Accuracy. Accuracy is the measure of how close the experimental value is to the true value. Recovery studies by the standard addition method were performed in a

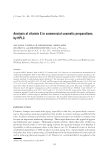
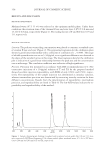
JOURNAL OF COSMETIC SCIENCE 356 view to justify the accuracy of the proposed method. A standard solution of the mix- ture containing both ester and base (10 μg/ml each) were spiked with 50, 100, and 200% extra standard and the mixtures were analyzed by the proposed method. The experiment was performed in triplicate. Recovery values (%) were calculated for each concentration. (d) Detection (LOD) and quantifi cation (LOQ) limits. In order to estimate the limit of detection and limit of quantifi cation, the blank sample was injected six times and the peak area of this blank was calculated (the noise level was determined). The limit of de- tection was calculated to be three times the noise level, and ten times the noise value gave the limit of quantifi cation (250 and 400 ng/ml for T and TA, respectively). (e) Sample solution stability. The stability of T/TA in solution during analysis was deter- mined by repeated analysis of the samples during the course of experimentation on the same day and also after storage of the drug solution for 72 h under laboratory bench con- ditions (25° ± 1°C) and refrigeration (8° ± 0.5°C). An accurately weighed quantity of vitamin E base and ester was dissolved in methanol to get a fi nal concentration of 10 μg/ ml. The solution was subjected to HPLC analysis immediately and after periods of 24, 48, and 72 hr. (f) System suitability tests. The chromatographic systems used for analyses must pass the system suitability limits before sample analysis can commence. The capacity factor (K), injection repeatability (as mentioned under Precision), the tailing factor (t), the theoreti- cal plate number (N) and the resolution (Rs) for the principal peak were tested on a 10-μg/ml sample of the T and TA mixture to assess the accuracy and precision of the developed HPLC system. (g) Analysis of vitamin E in lab and marketed cosmetic creams. Two creams (formu- lated in the lab) each containing about 0.5% T or TA, as well as four commercial creams, viz., A, B, C, and D containing only TA, were analyzed after being extracted by the following method: Five hundred milligrams of each of the preparations was weighed out, and a small amount of methanol was added for extraction by sonication ( J.P. Selecta s.a, Barcelona, Spain) for 15 min in order to dissolve the vitamin E base and ester. The mixture was transferred to a 50-ml standard fl ask and the volume was made up with methanol. The solution was centrifuged (Sorvall t-c-6, Newtown, CT) for 10 min at 3700 rpm and was fi ltered through a 0.45-μm fi lter and analyzed by HPLC. (h) Preparation of vitamin E-containing laboratory products. Two cream–emulsion cos- metic formulations were prepared according to the method reported by Zaghloul et al. (12) to simulate the complex composition of commercial cosmetic preparations, each containing about 0.5% T/TA (Table I). The cream was prepared by melting stearic acid in a porcelain dish over a water bath (75–80°C), then the semisolid ingredients (lanoline, white soft paraffi n, and Captex SBE) were added until all the mixture was melted, and fi nally soybean oil and corn oil were added (oily phase). Potassium hydroxide was dissolved in water followed by Acconon S-35, and then glycerin and sorbitol were added and the mixture was heated to 75°–80°C (aqueous phase). The aqueous phase was added to the oily phase with trituration, and the mixture was then removed from the water bath and mixing was continued until a homog- enous creamy liquid was obtained. Accurately weighed amounts of T and TA were added to the mixture, avoiding addition of the vitamin to the cream while hot to avoid possible
Purchased for the exclusive use of nofirst nolast (unknown)
From: SCC Media Library & Resource Center (library.scconline.org)