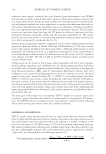
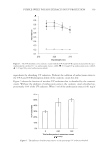
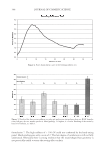
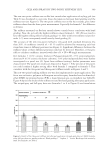
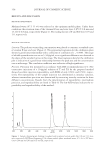
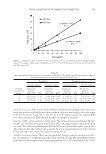
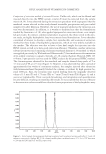
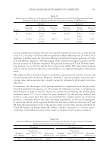
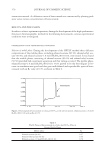
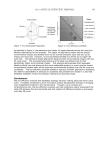
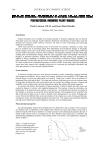
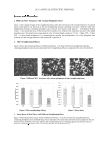
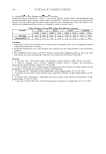
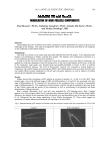
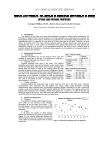
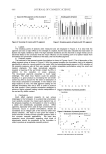
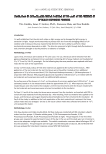
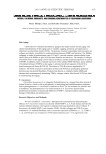
HPLC ANALYSIS OF VITAMIN E IN COSMETICS 359 Accuracy, as recovery. The recovery of the method, determined by spiking a previously ana- lyzed test solution with additional drug standard solution, was found to be in the range of 97.8–101.8% for T and 100.1–102.5% for TA. The high recovery (%) and low RSD (%) values presented in Table III indicate that the method is accurate. Detection (LOD) and quantifi cation (LOQ) limits. The limits of detection of T and TA were found to be 200 and 300 ng/ml respectively, where the drug could be detected without any noise. The limits of quantifi cation of T and TA were 250 and 400 ng/ml, respectively. This indicates that the method can be used for detection and quantifi cation of the vitamin E base and ester over a very wide range of concentrations. Stability of vitamin solution. There was no signifi cant change in analyte composition (sam- ple concentration = 10 μg/ml) until the end of a period of 72 hr. The mean RSD between peak areas for the samples stored under refrigeration (8° ± 1°C) was found to be 0.90% Figure 2. Calibration curve of vitamin E base (tocopherol) and ester (tocopherol acetate) RP Waters Sym- metry C-18 column mobile phase: methanol-water, 97:3 %v/v UV detection at 290 nm and 283 nm for T and TA, respectively. Table II Intra- and Interday Precision Data of the Analytical Method for Tocopherol and Tocopherol Acetate Based on Prepared and Found Concentrations (mean ± %RSD) (n=5) Tocopherol Tocopherol acetate Intraday analysis Interday analysis Intraday analysis Interday analysis Prepared concentration (μg/ml) Found conc. (μg/ml), mean ± SD RSD Found conc. (μg/ml), mean ± SD RSD Found conc. (μg/ml), mean ± SD RSD Found conc. (μg/ml), mean ± SD RSD 5 4.61 ± 0.07 1.54 5.18 ± 0.08 1.60 5.12 ± 0.14 2.77 5.12 ± 0.11 2.22 10 9.26 ± 0.24 2.61 10.16 ± 0.09 0.90 10.05 ± 0.07 0.73 10.75 ± 0.35 3.24 25 23.7 ± 0.39 1.64 26.16 ± 0.85 3.26 25.00 ± 0.26 1.05 25.62 ± 0.86 3.35

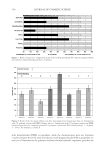
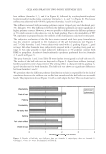
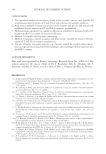
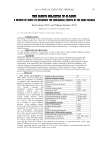
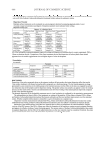
JOURNAL OF COSMETIC SCIENCE 360 and 3.24% for T and TA, respectively. At laboratory temperature (25° ± 1°C), the cor- responding values were 1.7% and 1.29% for T and TA, respectively, suggesting that the drug solution can be stored without any degradation for the time interval studied. System suitability tests. The results of the system suitability tests mentioned in Table IV, ensure the adequacy of the proposed HPLC method for routine analysis of TA and T. The precision test and the tailing factor studies show good injection repeatability and peak symmetry, respectively. The values of capacity factor for ester and base (k ≥ 2) indicate that the peaks are well resolved with respect to the void volume. Also, the theoretical plate numbers (N ≥ 2000) refl ect good column effi ciency. The resolution value confi rms good separation of the two forms of vitamin E. Analysis of vitamin E/acetate in lab and marketed creams. A single sharp peak of T/TA was observed at its respective retention time when a suitably diluted solution of the cream was injected following extraction. No interaction was observed between T/TA and the excipients present in the formulae. The vitamin content determined with RSD values less than 5 % (Table V) indicates the suitability of this method for routine analysis of T and TA (individually and in combination) in pharmaceutical and cosmetic preparations. Table III Intraday Accuracy of Tocopherol and Tocopherol Acetate (mean ± %,RSD) (n = 5) Standard conc. (μg/ml) Excess added (μg/ml) Theoretical content (μg/ml) Tocopherol Tocopherol acetate Conc. obtained (μg/ml) ±RSD Recovery (%) Conc. obtained (μg/ml) ±RSD Recovery (%) 10 5 15 14.68 ± 1.8 97.8 15.3 ± 0.5 102.5 10 10 20 19.54 ± 0.5 97.7 20.3 ± 0.8 101.6 10 20 25 25.49 ± 1.4 101.8 25.04 ± 0.8 100.17 Table IV HPLC System Suitability Tests for Tocopherol (T) and Tocopherol Acetate (TA) Test Tocopherol (T) Tocopherol acetate (TA) Precision 0.66 0.56 (injection repeatability) Tailing factor (asymmetry) 0.93 1 Capacity factor (k) 2.72 4.0 Theoretical plate count (N) 2151.68 2765.7 Resolution 4.47 (between T and TA) Table V Concentration of Vitamin E (base) and Vitamin E Acetate (ester) in the Laboratory and Commercial Cosmetic Products Product Ester/base Concentration (%w/w) ± SD %RSD Lab preparation 1 Base 0.57 ± 0.02 3.54 Lab preparation 2 Ester 0.66 ± 0.03 1.54 Commercial cream A Ester 0.107 ± 0.001 0.78 Commercial cream B Ester 0.670 ± 0.019 2.83 Commercial cream C Ester 0.591 ± 0.084 14.25 Commercial cream D Ester 0.579 ± 0.034 5.80
Purchased for the exclusive use of nofirst nolast (unknown)
From: SCC Media Library & Resource Center (library.scconline.org)