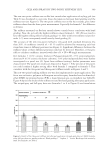
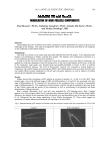
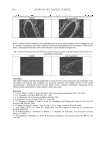
HPTLC DETERMINATION OF KETOCONAZOLE 369 Working standard solutions (3–20 mg/ml) were obtained by appropriate dilution of the ketoconazole stock solution in ethanol. As samples, three ketoconazole shampoos, including Nora, Kenalyn, and Nizoral, were taken for analysis. Each sample contained 2% of ketoconazole in an aqueous suspension consisting of coconut fatty acid diethanolamide, disodium monolauryl ether sulfosucci- nate, FD & C Red No. 40, hydrochloric acid, imidurea, laurdimonium hydrolyzed animal collagen, macrogol 120 methyl glucose dioleate, perfume bouquet, sodium chloride, so- dium hydroxide, sodium lauryl ether sulfate, and purifi ed water. Three ketoconazole creams, including Nizoral, Fungasin, and Ketazon, were taken for analysis. Each gram of white, odorless cream contained ketoconazole 20 mg (2%). Nonmedicinal ingredients were cetyl alcohol, isopropyl myristate, polysorbate, propyl- ene glycol, purifi ed water, sodium bisulfi te, sorbitan monostearate, and stearyl alcohol. All samples were purchased from drugstores in Chiang Mai Province, Thailand. Preparation of sample solutions. Shampoo and ketoconazole cream samples containing keto- conazole were transferred to a tarred 50-ml screw-capped centrifuge tube and accurately weighed. A 50-ml sample of ethanol was added (ca. 2%). The tube was agitated for 10 min and centrifuged at 7,600 rpm for 10 min. The clear supernatant was collected in a stoppered test tube and used for spotting on the TLC plate. Commercially available pre- coated silica gel 60 F254 plates (Merck 10 ´ 20 cm, 0.25-mm thickness) were employed. The plates were activated for 30 min at 120°C prior to use. APPARATUS A Linomat IV (CAMAG) was used for sample application. An automated multiple devel- opment (AMD system) of CAMAG was used for chromatographic development. A TLC Scanner III (CAMAG, Switzerland), computer-aided testing software (CATS) for evaluation, a deuterium lamp, and scanning by absorbance at 298 nm (evaluation via peak area) were also used. PROCEDURES The plate fi rst was cleaned up by development with acetone in a saturated tank. Later, the plate was dried at room temperature. Standard ketoconazole in ethanol solutions con- taining 3, 5, 7, 10, and 20 mg/ml of ketoconazole and the sample solutions (shampoo or ketoconazole cream samples) were applied, respectively, on a precoated silica gel 60 F254 aluminum plate (Merck 10´20 cm, 0.25-mm thickness). A Linomat IV was employed with a constant rate of 3 s/ml, a 3-mm band width was applied, and the space between two bands was 5 mm. The plate was inserted into an automated multiple development (AMD) system containing ethanol-acetone-1.0 mol/l H2SO4 (80:10:10, v/v/v) as the mobile phase, which was saturated with solvent vapor for 15 min prior to use. The plate was developed to a height of 9 cm. The chromatogram was dried automatically in the cham- ber and then viewed under short-wavelength UV light (254 nm) to mark the scanning area. The peak area of each band was quantitatively measured by means of a TLC scanner III at a wavelength of 298 nm, under the following parameters: Photo mode: refl ection scan mode: zigzag. Other parameters were set according to the Camag TLC scanner’s

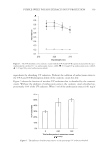
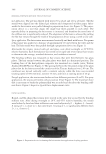
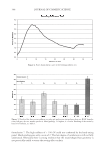
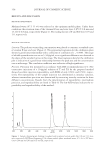
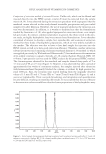
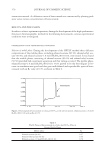
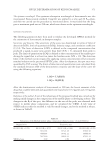
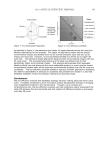
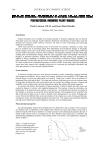
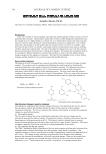
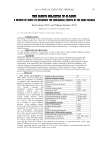
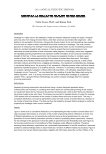
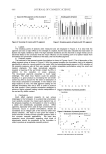
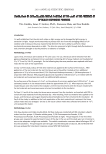
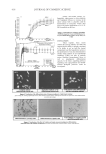
JOURNAL OF COSMETIC SCIENCE 370 instruction manual. A calibration curve of ketoconazole was constructed by plotting peak areas versus various concentrations of ketoconazole. RESULTS AND DISCUSSION In order to achieve optimum separation, during the development of the high-performance thin-layer chromatographic method for determining ketoconazole, various experimental conditions were investigated. OPTIMIZATION OF THE EXPERIMENTAL CONDITIONS Selection of mobile phase. During the development of the HPTLC method three different compositions of the mobile phase, including ethanol-acetone (90:10), ethanol-ethyl ace- tate (50:50), and ethanol-acetone-1.0 mol/l H2SO4 (80:10:10), were tested. It was found that the mobile phases consisting of ethanol-acetone (90:10) and ethanol-ethyl acetate (50:50) provided bad constituent separation and that tailing occurred. The mobile phase, ethanol-acetone-1.0 mol/l H2SO4 (80:10:10, v/v/v) proved to be the best (Figure 2) be- cause its resolution was good and also gave well-defi ned and reproducible spots of keto- conazole with an Rf value of 0.70, as shown in Table I. Table I The Rf Values of Ketoconazole on a Silica Gel 60 F254 Plate in Various Mobile Phases Mobile phase Rf Ethanol-acetone (90:10) 0.57 Ethanol-ethyl acetate (50:50) 0.56 Ethanol-acetone-1.0 mol/l H2SO4 (80:10:10) 0.70 Figure 2. Densitogram of ketoconazole on silica gel 60 F254 in the solvent system, ethanol-acetone-1.0 mol/l H2SO4 (80:10:10) with an Rf of 0.70.
Purchased for the exclusive use of nofirst nolast (unknown)
From: SCC Media Library & Resource Center (library.scconline.org)