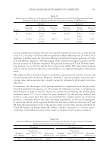
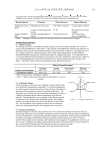
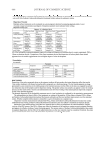
HPLC ANALYSIS OF VITAMIN E IN COSMETICS 357 degradation. This resulted in nominal concentrations of 0.532% and 0.539% w/w, respectively. The fi nal cream was fi lled in well-closed plastic jars. (i) Commercial cosmetic products. Four commercial products (A, B, C, and D), obtained from retail pharmacies, were used to validate the proposed analytical HPLC method and the extraction method. The products contained only TA without declaration of its quantity. The commercial and cosmetic preparations were tested for emulsion type by the dilution method, performed by mixing about 1-g samples of each with about 5 ml of distilled water and observing them for phase separation. Both experimental formulations and products A, B, and C were O/W emulsions, while product D was a W/O emulsion. (j) Method of extraction of vitamin E/acetate from cosmetic products. Initially, isopropyl alcohol was utilized as the solvent for extraction of T/TA with reference to the method reported by Guaratini et al. (8). An approximately 500-mg sample of the formulation was taken in a 50-ml volumetric fl ask containing 20 ml of isopropyl alcohol. The sample was extracted by sonication for 20 min and centrifuged at 3700 rpm for 10 min after making up the volume to 50 ml with isopropyl alcohol. The supernatant samples were fi ltered through a 0.45-μm cellulose fi lter and were intended to be used for injection by the re- ported HPLC method. Further trials were run using n-hexane-methanol (1:9 v/v) as the extraction solvent (method 1) or 100% methanol (method 2). In each method, a 500-mg sample of the for- mulation was extracted similarly as that described above under the extraction method by isopropanol. The supernatant of the extracts was fi ltered through a 0.45-μm cellulose fi lter and was found to be clear it was therefore used for injection. The extraction meth- ods differ basically in the polarity of the extraction solvent system. The relative extraction effi ciency of both methods was assessed in terms of the percent recovery before and after addition of a known quantity (2.5 μg) of T and TA to 500-mg samples of the products. (k) Statistical analysis. The difference in the mean percent recovery of T and TA from the cosmetic products with the two methods of extraction was tested for statistical signifi - cance using a t-test and the non-parametric Mann-Whitney test. Table I General Formula of Laboratory Formulations Containing 0.5% (w/w) of Vitamin E or Vitamin E Acetate Ingredient Percent (w/w) Stearic acid 6 White soft paraffi n 4 Lanoline 4 Soybean oil 8.4 Corn oil 8.3 Captex SBE (caprylic/capric/ stearic triglyceride) 4 Glycerol 11 Sorbitol 15 Acconon S-35 (PEG-35 soy glycerides) 5 Potassium hydroxide 0.28 Water 34.02

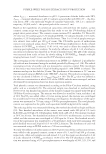
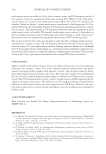
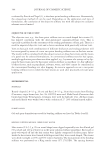
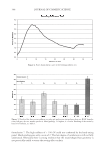
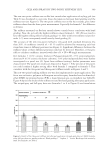
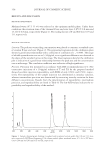
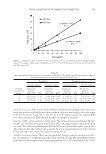
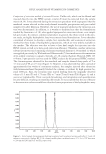
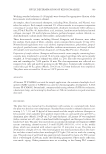
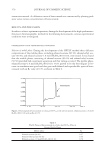
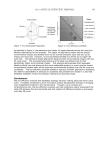
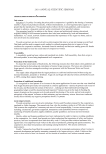
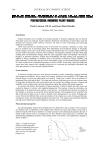
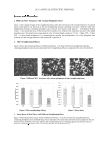
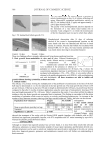
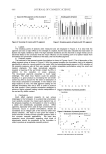
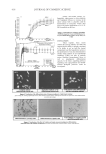
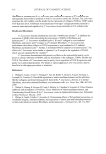
JOURNAL OF COSMETIC SCIENCE 358 RESULTS AND DISCUSSION METHOD DEVELOPMENT Methanol-water (97:3 % v/v) was selected as the optimum mobile phase. Under these conditions the retention time of the vitamin E base and ester were 9.870 ± 0.8 min and 13.240 ± 0.8 min, respectively (Figure 1). The tailing factors of T and TA were 0.93 and 1.0, respectively. METHOD VALIDATION Linearity. The peak area versus drug concentration was plotted to construct a standard curve of vitamin E base and ester (Figure 2). The polynomial regression for the calibration plots showed a good linear relationship with a coeffi cient of correlation of r = 0.9995. The range of reliable quantifi cation was set at 5–50 μg/ml, as no signifi cant difference was observed in the slopes of the standard curves in this range. The linear regression data for the calibration plot is indicative of a good linear relationship between the peak area and the concentration over a wide range. The correlation coeffi cient was indicative of high signifi cance. Precision. Precision was measured in accordance with ICH recommendations (13). Five consecutive injections of a 10-μg/ml solution of T and TA by the proposed method showed excellent injection repeatability, with RSDs of only 0.66% and 0.56%, respec- tively. The repeatability of the sample injection was determined as intraday variation, whereas intermediate precision was determined by measuring interday variation for three different concentrations. Results from the determination of repeatability, intermediate precision, and reproducibility are listed in Table II. The low RSD values indicate the re- peatability and reproducibility of the method. Figure 1. Sample chromatogram showing tocopherol and tocopherol acetate peaks after 9.8 and 13.2 min- utes, respectively. RP Waters Symmetry C-18 column mobile phase: methanol-water, 97:3 %v/v UV detec- tion at 290 nm and 283 nm for T and TA, respectively.
Purchased for the exclusive use of nofirst nolast (unknown)
From: SCC Media Library & Resource Center (library.scconline.org)