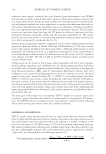
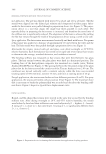
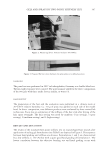
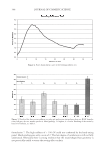
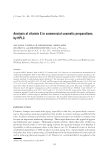
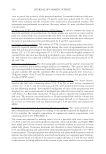
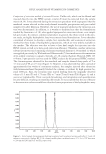
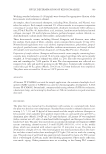
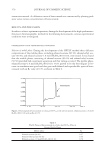
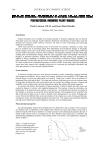
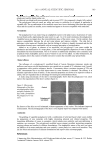
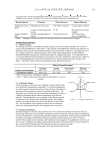
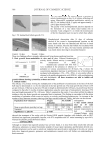
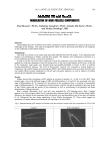
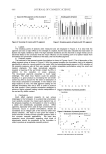
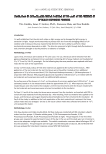
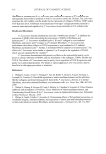
HPLC ANALYSIS OF VITAMIN E IN COSMETICS 361 Comparison of extraction methods of vitamin E/acetate. Unlike oils, which can be diluted and injected directly into the HPLC system, vitamin E must be extracted from the sample matrix (9,14). It was observed during the extraction procedure with isopropanol that the marketed creams selected in this study showed inevitable precipitation and gave turbid samples even after fi ltration. Therefore, the use of isopropyl alcohol as the extraction sol- vent was discontinued. In addition, it is worthy to mention here that the formulations studied by Guaratini et al. (8), who applied ispropanol as extraction solvent, were simple lab gel creams. In contrast, commercial products in general, like those tested in the pres- ent study, are highly hydrophobic fatty/waxy matrix-based formulations. It was therefore considered of interest to develop a simple, fast, reproducible, and economical extraction method for these kinds of hydrophobic preparations, which are very widely available in the market. The objective was also to have a clear fi nal sample for injection into the HPLC system as well as to have good extraction effi ciency. Therefore, another extraction solvent system was tried consisting of a hexane-methanol mixture (1:9) (method 1), which was applied previously by Wielinski and Olszanowski (7) for simultaneous determination of fat-soluble vitamins in capsules. Initially, a C-18 column (Agilent Hypersil-ODS 125 × 4-mm 5-μm particle size) was used for HPLC analysis by the proposed HPLC method. The chromatograms obtained for the standards and samples showed sharp peaks of T at 3.5 min and of TA at 4.75 min (Figure 3). However, it was observed that after a period of approximately four weeks of continuous analysis, the samples injected after extraction with hexane-methanol frequently blocked the column, as evident by high pressure be- yond 4000 psi. Also, the retention time started drifting from the originally observed values of 3.5 min (T) and 4.75 min (TA) to 7 min (T) and 9 min (TA) (Figure 4), and it was never reproducible. There was peak broadening, and integration and quantifi cation became diffi cult, resulting in irreproducible results. It was assumed that the use of hexane in the extraction solvent would have dissolved some proportions of the hydrophobic waxy Figure 3. Initial sample chromatogram showing tocopherol and tocopherol acetate peaks after 3.5 and 4.8 minutes, respectively. Agilent RP–C-18 column mobile phase: methanol-water, 97:3 %v/v UV detection at 290 nm and 283 nm for T and TA, respectively.

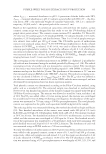
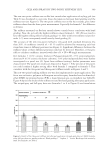
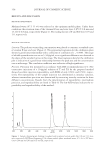
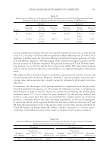
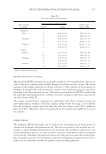
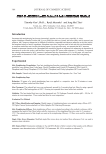
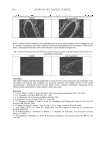
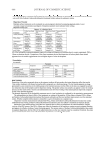
JOURNAL OF COSMETIC SCIENCE 362 excipients present in the commercial creams, which were not eluted out, eventually caus- ing irreparable damage to the column. Hence, based on further literature survey, methanol was tried as the extraction solvent (method 2), which was previously applied by Huo et al. for extraction of tocopheryl ace- tate and tocopherols from aquatic organisms and fi sh feed (6). A new column (Waters Symmetry-ODS, 150 × 4-mm 5-μm particle size) was used, and based on the previous experience, it was considered necessary to introduce a guard column to prevent any pos- sible damage to the column and to increase its longevity. Sharp reproducible peaks were obtained at 9.7 and 13.2 min. for T and TA, respectively (Figure 1). Therefore, all valida- tion studies and analyses of lab and commercial products were carried out using the same extraction procedure (method 2) and using the new Waters column. No antioxidant was added, since the extraction procedure does not include the saponifi cation process (9). Extraction effi ciency with laboratory formulations. The adopted methods of extraction proved to be effi cient for T and TA when laboratory formulations were subjected to HPLC analysis. This was indicated by high mean recovery values (Table VI). High extraction was achieved with mean values of 99.87 (method 1) and 97.24% (method 2). The corresponding mean values determined for TA were 98.54 (method 1) and 97.89 (method 2). This indicates that either methanol alone (method 2) or with 10% of hexane could selectively extract T and TA from the laboratory products without an interference from the additives. Extraction effi ciency with the commercial product (C). The commercial product contained only TA, while no mention of T was indicated under the ingredients. Therefore, the relative ef- fi ciency of both methods of extraction was based on comparison of the found TA concentra- tion. The observed concentrations of TA were 0.586% and 0.562% with method 1 and method 2, respectively, with relative standard deviations less than 4.79% (n=4). This indi- cates that both methods are quite equivalent and that none of the additives in the commer- cial cosmetic product interfered with the estimation of TA. There was no signifi cant Figure 4. Late sample chromatogram, four weeks after starting analysis, showing tocopherol and tocopherol acetate peaks after 7.0 and 9.5 minutes, respectively. Agilent RP–C-18 column mobile phase: methanol- water, 97:3 %v/v UV detection at 290 nm and 283 nm for T and TA, respectively.
Purchased for the exclusive use of nofirst nolast (unknown)
From: SCC Media Library & Resource Center (library.scconline.org)