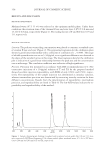
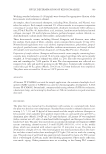
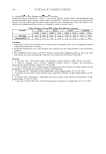
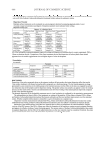
HPTLC DETERMINATION OF KETOCONAZOLE 371 The optimum wavelength. The optimum absorption wavelength of ketoconazole was also investigated. Ketoconazole standard (5 mg/ml) was applied to a silica gel 60 F254 plate, and then we carried out the procedure as mentioned above. It was found that the drug gave a maximum peak area at 298 nm, which was chosen as the optimum wavelength. METHOD VALIDATION The following parameters have been used to validate the developed HPTLC method for the estimation of ketoconazole in shampoo samples: Sensitivity and linearity. The sensitivity of the assay was determined in terms of limit of detection (LOD), limit of quantitation (LOQ), linearity range, and correlation coeffi cient (33,34). The limit of detection (LOD) is defi ned as the compound concentration that produced a signal-to-noise ratio greater than three (S/N = 3), measured from peak to peak. The limit of quantitation (LOQ) is defi ned as that concentration of the analyte pro- ducing the signal that is at least ten times the baseline noise (S/N = 10). The detection limit of the method was investigated by applying various concentrations of ketoconazole standard solution to the precoated HPTLC plate. After development, the spot areas were quantifi ed by TLC scanner. The limits of detection and quantitation were calculated from the standard deviation (SD) of the densitometric response and the slope of the curve (S) using the following equations: LOD = 3.3(SD/S) LOQ =10(SD/S) After the densitometric analysis of ketoconazole at 298 nm, the lowest amounts of the drug that could be detected and quantifi ed were found to be 0.72 mg/ml and 2.18 μg/ml, respectively. Robustness of the method. A test of the robustness of the proposed method was carried out by making small changes in the composition of the mobile phase or developing solvent. The changes in the Rf of the spot, the difference in the area of the peak, was observed with respect to mobile phase composition, and we calculated the %RSD. A low value of %RSD indicates that the method is valid for small changes, and so the method is robust, as shown in Table II. Table II Robustness of the Method (mobile phase composition (ethanol-acetone-1.0 mol/l H2SO4)) Original (v/v) Used (v/v), area 80:10:10 (Rf = 0.70) 89:10:1 (Rf = 0.57) 85:10:5 (Rf = 0.66) 80:10:10 (Rf = 0.70) 76321.65 87321.48 87849.16 76464.85 93741.12 90644.85 76475.60 90592.44 87913.44 %RSD of area 0.09 2.89 1.46

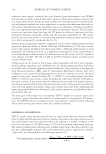
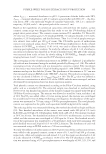
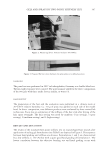
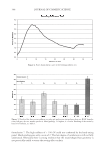
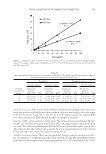
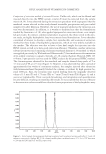
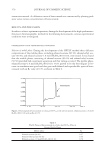
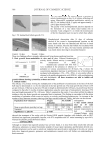
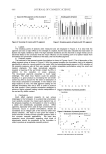
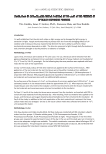
JOURNAL OF COSMETIC SCIENCE 372 Linearity. The linear range of the standard curve was also studied. The plate was developed in acetone for elimination of impurity. Then the standard ketoconazole solutions containing 3, 5, 7, 10, and 20 mg/ml of ketoconazole were applied to a silica gel 60 F254 plate and determined by using the procedure mentioned in the Experimental section. A linear relationship between peak areas and various concentrations of ketoconazole was estab- lished over the range of 3–20 mg/ml (Figure 3), with a correlation coeffi cient of 0.9992. Precision and accuracy. The precision of the method was established by using solutions of two different concentrations, 5 mg/ml and 10 mg/ml, of ketoconazole standard solution. Each was analyzed three times (n=3) on the same day, and the relative standard deviation (RSD) was calculated to ascertain intraday precision. The studies were also repeated on three different days to establish interday precision. The results are presented in Table III. The accuracy of the proposed HPTLC method was also investigated. Known quantities of ketoconazole were added to previously analyzed samples of ketoconazole and analyzed by the proposed method. The average percentage recovery of shampoo A, shampoo B, shampoo C, cream A, and cream B were found to be 96.10, 97.06, 99.58, 96.77, 97.26 and 95.74, respectively. The mean recoveries at each level for all the components, given in Table IV, ranged between 91.68% and 100.59% (acceptance criteria: 90–110%), and the %RSD was between 1.15% and 7.93% (acceptance criteria: NMT 10.0%), establishing that the method was accurate for the quantitative determination of all the known and unknown impurities (33,34). Table III Precision Study for Ketoconazole Intraday precision (n=3) Interday precision (n=3) Ketoconazole (μg/ml) Concentration (μg/ml) %RSD Concentration (μg/ml) %RSD 5 5.02 1.72 5.11 0.69 10 10.07 2.18 10.06 0.94 Figure 3. Calibration graph for ketoconazole obtained by the HPTLC method (concentration range 3–20 μg/ml of ketoconazole).
Purchased for the exclusive use of nofirst nolast (unknown)
From: SCC Media Library & Resource Center (library.scconline.org)