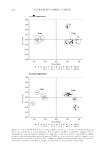
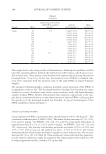
JOURNAL OF COSMETIC SCIENCE 246 rapid chemical and physical alterations in formulations, which are usually detected by quantifi cation of some components over time (6). Moreover, the kind of cosmetic packag- ing may also have great importance. The permeability of packaging materials is of great interest because this feature may change essential characteristics of products because of the reaction with environmental oxygen and carbon dioxide (7–9). The development of new materials, mainly polymers, and new fabrication methods have led to a substantial improvement in the quality and versatility of packaging materials (10). The use of ap- propriate types of packaging materials can improve the stability of cosmetics. There are few studies on the effect of packaging material on the stability of cosmetics. Available studies concern rather migration of some compounds from packaging to the product, which could be harmful to the consumer health (11), or the infl uence of cosmetic formulation on some properties of packaging materials (12). Santoro et al. (13) studied the stability of an emulsion containing ultraviolet A (UVA), ultraviolet B (UVB), and infrared sunscreens after storage in different packaging materials (glass and polypropylene fl asks polypropylene and aluminum tubes), but they observed no signifi cant changes in the physical and chemical stability of emulsions stored in different packaging materials. In recent years, Fourier transform near-infrared (FT-NIR) spectroscopy has found increased application in food, pharmaceutical, cosmetics, petrochemical, chemical, textile, polymer, and other industries (14–16). The NIR spectrum of a product is like its “chemical fi nger- print.” It could be applied to obtain qualitative (e.g. origin, type, and adulteration) or quantitative information (e.g. concentration of analyte) about a product. Principal compo- nent analysis (PCA) is commonly used for multivariate data reduction with minimum loss of information and to identify patterns in data, showing their similarities and differences. Multivariate calibration methods such as partial least squares (PLS) regression are used to look for the relationship between multivariate data, e.g., FT-NIR spectra, and other param- eters of a product. Possible calibration models can be used for the prediction of analyte concentration or parameters of a product from its FT-NIR spectrum (17,18). Studies concerning the application of FT-NIR spectroscopy for the evaluation of the effect of packaging materials on the overall quality of products are limited. They concern rather food products. Aday and Caner (19) compared the effect of three types of coatings, i.e., chitosan (polysaccharide), whey protein isolate, and shellac (lipid resin), on maintaining the quality of fresh cherry during storage. They used various measurements, including FT-NIR spectroscopy, and found that FT-NIR spectra are useful in predicting the sugar content and fi rmness of cherries. Colour measurements are very often used to monitor positive or negative alterations oc- curring in products, e.g., during storage however, such measurements were not used to study the effect of packaging materials on cosmetic products. Therefore, in the present study, FT-NIR spectroscopy and color measurements were pro- posed as tools to evaluate the infl uence of various packagings on the overall quality of cosmetic creams stored at refrigerated and room temperatures for 2 and 4 mo. PCA and PLS1 analyses were performed on multivariate data of cosmetic emulsions (FT-NIR spec- tra) to visualize the changes in creams during storage and to correlate them with the CIE (Comission Internationale de l’Eclairage) 1976 L*a*b* color parameters of creams, re- spectively. It is highly desirable to use the packaging that protects the original quality of a product during long-term storage. To the best of our knowledge, there are no studies concerning the usage of FT-NIR spectroscopy with chemometric analysis for testing the

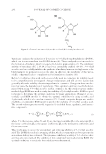
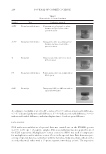
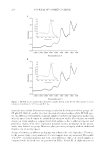
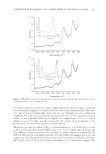
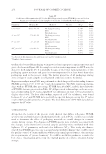
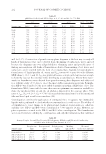
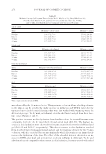
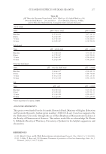
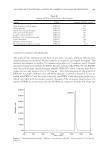
INFLUENCE OF PACKAGING ON COSMETIC EMULSION DURING STORAGE 247 overall changes in cosmetic emulsions stored in various packagings and for making the best choice of packaging protecting the original quality of cosmetic products during long-term storage. MATERIALS AND METHODS MATERIALS Moisturizing body creams with shea butter and cocoa, packed in opaque plastic contain- ers, were purchased from a local cosmetic store. They were from the same production batch to be sure that repacked samples will be uniform at the beginning of storage. The cosmetic emulsion was repacked into fi ve different cosmetic containers (30 ml) and stored in a refrigerator (4°–6°C) and at room temperature (22°–25°C) for 2 and 4 mo with natural access of light. Five samples were analyzed for each type of container. The characteristics of the cream containers, including aluminum jar with polypropylene thermos (Al/PP), transparent acrylic jar with polypropylene thermos (Ac/PP), glass (G) jar, polypropylene (PP) white jar, and transparent styrene acrylonitrile (SAN) jar, are presented in Table I. METHODS FOURIER TRANSFORM NEAR-INFRARED (FT-NIR) ANALYSIS The FT-NIR spectra of the cosmetic cream samples were measured using the MPA (multipurpose analyzer) FT-NIR spectrometer (Bruker Optik, GmbH, Ettlingen, Ger- many) with an integrating sphere for measuring solids and pastes in diffuse refl ection mode. A sample rotator (diameter 45 mm) assuring high reproducibility for heteroge- neous samples was applied. The FT-NIR spectra were measured in the range of 12,500– 4,000 cm-1. The spectral data of each sample were acquired 32 times with resolution of 16 cm-1 and collected using the OPUS software ver. 7.0 (Bruker Optik, GmbH, Ettlingen, Germany). COLOR MEASUREMENTS The color of the cosmetic cream samples was determined in the CIE 1976 L*a*b* color space. L* describes the lightness, a* indicates the intensity of the red (in the positive range) and the green color (in the negative range), and b* value indicates the intensity of yellow or blue color in the positive or negative range, respectively. All color functions were calculated for illuminant D65 and the 2° angle observer using the tristimulus values obtained using Minolta Chroma Meter CR200 (Konica Minolta, Tokyo, Japan) offering 8-mm-diameter measuring area and wide-area illumination/0° viewing geometry (d/0°). The cream samples were placed in granular-materials attachment CR-A50 (Konica Minolta) covered with a quartz plate. For each packaging, fi ve measurements were per- formed. Total color difference (ΔE*ab) between the values corresponding to the stored (s) and fresh (f) samples was calculated using the following equation: * * 2 * 2 * 2 1/2 * * * * * * * * =[( ) +( ) +( ) ] , where = – = – and = – % % % % % % %b* ab s f s f s f E L a b L L L a a a b b .
Purchased for the exclusive use of nofirst nolast (unknown)
From: SCC Media Library & Resource Center (library.scconline.org)