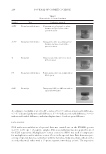
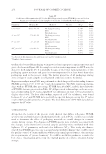
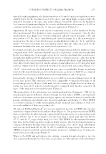
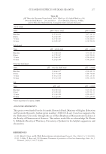
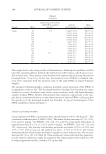
JOURNAL OF COSMETIC SCIENCE 248 According to Cserhalmi et al. (20), ΔE*ab values of 0–0.05 indicate unnoticeable difference, 0.5–1.5 indicate slightly noticeable difference, 1.5–3.0 indicate noticeable difference, 3.0–6.0 indicate well-visible difference, and values higher than 6.0 indicate great difference. DATA ANALYSIS PCA with cross-validation of spectral data was carried out on the FT-NIR spectra (12,500–4,000 cm-1) of cosmetic samples. Full cross-validation was also applied to all of the PLS1 regressions. Multiplicative scatter correction (MSC) was used to compensate for multiplicative and/or additive scatter effects in the spectral data. First derivative pro- cessing of spectral data was carried out with the Savitzky–Golay procedure, which used a second polynomial order with a 15-point segment (smoothing points). The regression Table I Characteristics of Cream Containers Symbol Type Packaging material Al/PP Round jar with thermos Aluminum jar, polypropylene white thermos and spacer, nut with a protective insert Ac/PP Round jar with thermos Transparent acrylic jar, polypropylene thermos and spacer, nut with a protective insert G Round jar Glass jar, nut with a protective insert, without spacer PP Round jar with thermos Polypropylene white jar, polypropylene white spacer SAN Round jar Transparent SAN jar, ABS nut with an expanded PE washer

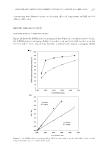
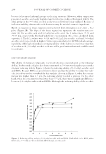
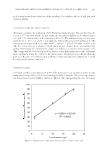
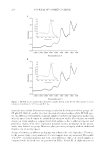
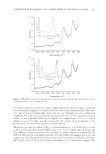
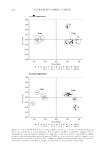
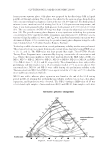
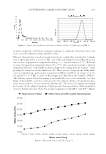
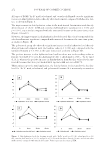
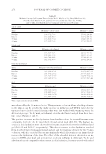
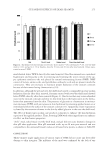
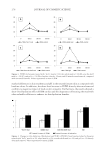
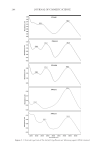
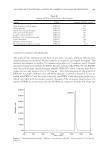
INFLUENCE OF PACKAGING ON COSMETIC EMULSION DURING STORAGE 249 relationships were evaluated using the coeffi cient of determination (R2). The data analysis was carried out using Unscrambler 7.0 (CAMO, Oslo, Norway) software. Differences between the color parameters of the fresh and stored samples were evaluated by using the least signifi cant difference (LSD) test at α = 0.05. RESULTS AND DISCUSSION In the present study, the infl uence of packaging on cosmetic creams stored in different conditions was monitored by FT-NIR spectroscopy and L*a*b* color measurements. Average FT-NIR spectra of fresh samples and samples stored at refrigerated conditions for 2 and 4 mo and their fi rst derivatives are presented in Figures 1 and 2. No visible changes were observed in the FT-NIR spectra without data processing for samples stored in different packagings both in the cold (Figure 1A) and at room temperature for 2 mo (Figure 2A). Some differences were observed between the fi rst derivative of the FT-NIR spectra of samples stored for 2 mo at refrigerated conditions in SAN jars as compared with other samples (Figure 1A). After 4 mo, a decrease in the intensity of bands at about 7,170 and 5,310 cm-1 was observed for all samples as compared with samples of fresh cream (Figures 1B and 2B). It is especially visible for samples stored at room temperature in glass jars (Figure 2B). These bands could be associated with the content of water. A strong water absorption band exists at about 1,450 nm (6,900 cm-1 OH vibration of water) and at 1,940 nm (5,155 cm-1 a combination band involving OH stretching and OH deformation) (14). In contrast to other packagings used in the present study, glass jar had packaging without thermos or an additional spacer between the nut and the content of the jar. This could be the reason for the most visible changes in the content of water in the samples stored in this packaging. PCA was performed on FT-NIR spectra to visualize the changes in cream samples during storage. The PCA results of the FT-NIR spectra of cosmetic emulsions stored in the cold and at room temperature for 2 and 4 mo are presented in Figure 3. The effect of time on cream samples stored in Al/PP, Ac/PP, G, PP, and SAN jars was observed separate groups were formed by fresh samples (F) and samples stored for 2 and 4 mo. The fi rst two principal components (PC1 and PC2) described 98% of the total data variance of samples stored both in the refrigerated conditions and at room temperature (Figure 3). The fi rst principal component PC1 that explained 94% (samples stored in the cold) and 92% (samples stored at room temperature) of the total data variance was linked to the time of storage. It differentiated samples stored for 4 mo from fresh samples (F) and those stored for 2 mo. The PC2 explained 4% and 6% of the total data variance of samples stored in the cold and at room temperature, respectively. It was related to the variability due to the type of samples (fresh and stored samples). It was found that the changes in samples stored in the cold for 2 mo were similar for all applied packaging materials as compared with fresh samples (F), although samples in SAN jars formed a separate group (Figure 3A). After 4 mo, a separate group was formed by samples stored in glass (G) jars. For samples stored at room temperature, the infl uence of packaging materials on cosmetic emulsions was observed just after 2 mo of storage (Figure 3B). The smallest changes in the FT-NIR spectrum of a cream as compared with the fresh one (F) were observed for samples stored in Al/PP. The changes for other packaging
Purchased for the exclusive use of nofirst nolast (unknown)
From: SCC Media Library & Resource Center (library.scconline.org)