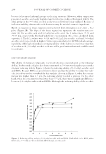
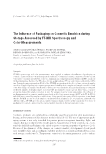
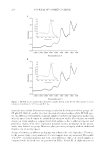
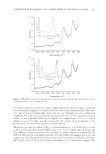
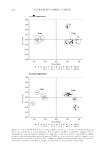
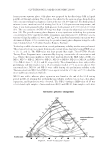
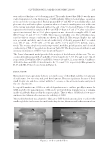
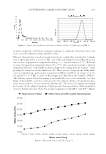
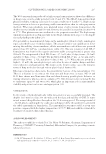
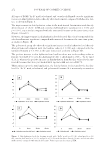
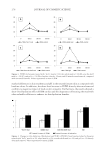
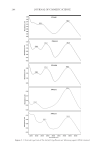
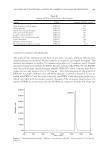
JOURNAL OF COSMETIC SCIENCE 252 Figure 3. PCA of the FT-NIR spectra of cream samples stored for 2 and 4 mo in different packagings (A) in the cold and (B) at room temperature: F, fresh samples Al/PP_2 and Al/PP_4, samples stored in alumnium jars with polypropylene thermos for 2 and 4 mo, respectively Ac/PP_2 and Ac/PP_4, samples stored in acrylic jars with polypropylene thermos for 2 and 4 mo, respectively G_2 and G_4, samples stored in glass jars for 2 and 4 mo, respectively PP_2 and PP_4, samples stored in propylene jars for 2 and 4 mo, respectively and SAN_2 and SAN_4, samples stored in SAN jars for 2 and 4 mo, respectively.

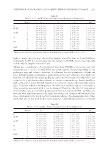
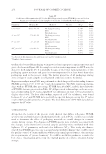
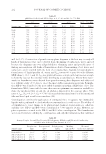
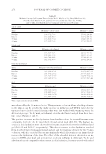
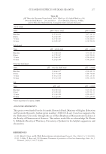
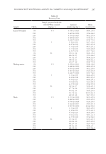
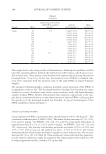
INFLUENCE OF PACKAGING ON COSMETIC EMULSION DURING STORAGE 253 highest changes in color were observed for samples stored for 4 mo in G and SAN jars, followed by Ac/PP. It is noteworthy that the changes in FT-NIR spectra were especially visible only for samples stored in G jars. Taking into consideration all experimental data from FT-NIR spectroscopy and color measurements, it can be concluded that the cream samples changed depending on the packaging type and storage conditions. It is known that the permeation of light and gases through polymer packaging is particularly diverse and sometimes very high (21), therefore not all kinds of polymer packaging can be used for storage of food products and cosmetics. It is also known that polymers, as organic compounds, are characterized by a high coeffi cient of linear thermal expansion in contrast to many other materials such as glass. Under the infl uence of temperature, the density of polymers and, as a consequence, other properties associated with it can be changed. Therefore, the effect of temperature must be taken into account when polymer properties are examined. SAN copolymer is a material with high transparency for light, but with good chemical and thermal resis- tance. Aluminum is the metal used for vacuum metalizing of packaging materials. Orig- inally, this process was used for decorative purposes. Currently, metallization is a widely Table II The L*, a*, b*, and ΔE* Values of Cream Stored at Refrigerated Temperature Month L* a* b* ΔE* F 0 80.50 ± 0.11 –2.73 ± 0.01 2.16 ± 0.04 0 Al/PP 2 80.48 ± 0.12 –2.74 ± 0.01 2.10 ± 0.16 0.16 ± 0.12 4 80.80 ± 0.02a –2.83 ± 0.02a 2.18 ± 0.04 0.31 ± 0.02 Ac/PP 2 80.43 ± 0.12 –2.72 ± 0.01 2.18 ± 0.05 0.13 ± 0.04 4 80.75 ± 0.11a –2.83 ± 0.04a 2.30 ± 0.02a 0.31 ± 0.09 G 2 80.50 ± 0.03 –2.69 ± 0.01a 2.16 ± 0.01 0.05 ± 0.01 4 80.82 ± 0.03a –2.81 ± 0.02a 1.87 ± 0.01a 0.44 ± 0.02 PP 2 80.58 ± 0.08 –2.70 ± 0.03 2.14 ± 0.10 0.15 ± 0.04 4 81.15 ± 0.05a –2.87 ± 0.02a 2.27 ± 0.02a 0.68 ± 0.04 SAN 2 80.51 ± 0.07 –2.72 ± 0.03 2.14 ± 0.06 0.09 ± 0.01 4 80.98 ± 0.03a –2.88 ± 0.02a 2.15 ± 0.03 0.50 ± 0.03 a Means in the column are signifi cantly different from that of fresh sample (LSD test, α = 0.05). Table III The L*, a*, b*, and ΔE*ab Values of Cream Stored at Room Temperature Month L* a* b* ΔE*ab F 0 80.50 ± 0.11 –2.73 ± 0.01 2.16 ± 0.04 0 Al/PP 2 79.66 ± 0.06a –2.44 ± 0.02a 2.35 ± 0.13a 0.92 ± 0.03 4 79.43 ± 0.05a –2.35 ± 0.03a 2.44 ± 0.08a 1.17 ± 0.03 Ac/PP 2 79.41 ± 0.23a –2.29 ± 0.01a 2.28 ± 0.10 1.19 ± 0.21 4 79.34 ± 0.23a –2.09 ± 0.03a 2.53 ± 0.03a 1.38 ± 0.20 G 2 79.66 ± 0.09a –2.30 ± 0.01a 2.32 ± 0.05a 0.96 ± 0.07 4 79.27 ± 0.21a –1.98 ± 0.02a 2.43 ± 0.02a 1.46 ± 0.04 PP 2 79.72 ± 0.07a –2.44 ± 0.02a 2.37 ± 0.04a 0.86 ± 0.07 4 79.70 ± 0.05a –2.27 ± 0.02a 2.60 ± 0.02a 1.02 ± 0.03 SAN 2 79.56 ± 0.15a –2.30 ± 0.02a 2.11 ± 0.07 1.03 ± 0.14 4 79.20 ± 0.08a –2.12 ± 0.02a 2.19 ± 0.04 1.44 ± 0.07 a Means in the column are signifi cantly different from that of fresh sample (LSD test, α = 0.05).
Purchased for the exclusive use of nofirst nolast (unknown)
From: SCC Media Library & Resource Center (library.scconline.org)