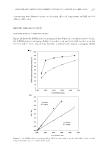
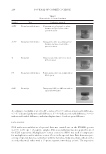
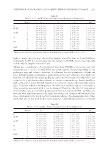
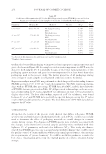
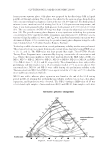
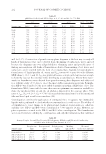
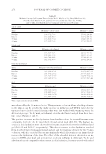
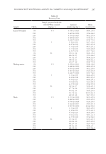
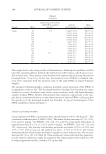
JOURNAL OF COSMETIC SCIENCE 262 will be (1,15). Construction of pseudo-ternary phase diagrams is the best way to study all kinds of formulations that can be derived from the mixing of surfactants, water, and oil because the diagrams can cover all probabilities of mixing ratios and possible areas of fi nding nanoemulsion. All kinds of formulations derived from mixing of oil, water, and surfactants can be studied with the help of a ternary phase diagram for nanoemulsion formulations of liquid paraffi n oil, water, and Smix (tween 80 + span 80) with different HLB values 9, 10, 11, and 12. Smix was preferred because a single surfactant was not enough to form the layer at the interface while developing a nanoemulsion. Thirty-three nano- emulsion formulations were derived from pseudo-ternary phase diagrams and subjected to a stability study of 90 days to select the most stable nanoemulsion system. Formula- tion NE-19 was found to be the most stable formulation having a HLB value of 10. The formulation NE-19 was stable because there was an optimum concentration available to make the interfacial fi lm around the oil globules dispersed in the aqueous phase. This ratio of Smix (T80 = 4.26%: S80 = 3.74%) increased the interfacial tension of the interfacial fi lm and developed a stable nanoemulsion (18). Centrifugation involves the application of centripetal force to separate two immiscible liquids and is performed to check whether a nanoemulsion is stable or not. The ability of a formulation to resist change in its physical and chemical characteristics is called its stability (16). NE-19 and B-19 were centrifuged at 5,000 rpm for 10 min. However, no phase separation occurred in the NE-19 and B-19 after centrifugation. The formulations were tested for kinetic stability by centrifugation, and only the formulations that exhibited Table II pH Values for B-19 and NE-19 Kept at 4, 25, 40, and 40°C + 75% RH Storage time 4°C 25°C 40°C 40°C + 75% RH B-19 NE-19 B-19 NE-19 B-19 NE-19 B-19 NE-19 Fresh 5.92 5.79 5.92 5.79 5.92 5.79 5.92 5.79 24 h 5.72 5.53 5.61 5.59 5.64 5.53 5.43 5.49 48 h 5.43 5.39 5.28 5.48 5.35 5.11 4.98 5.38 72 h 5.31 5.28 5.12 5.33 5.21 4.95 4.92 5.24 7 d 5.14 5.16 5.04 5.21 5.09 4.87 4.87 5.09 14 d 4.98 5.03 4.91 4.98 4.93 4.84 4.81 4.92 21 d 4.82 4.92 4.68 4.72 4.82 4.72 4.77 4.81 28 d 4.69 4.78 4.49 4.67 4.71 4.68 4.64 4.73 45 d 4.54 4.76 4.41 4.63 4.63 4.65 4.51 4.69 60 d 4.49 4.61 4.39 4.60 4.54 4.61 4.39 4.67 90 d 4.41 4.53 4.35 4.47 4.48 4.43 4.31 4.37 Table III Average Droplet Size and Zeta Potential, Polydispersity, Mobility, and Electrical Conductivity of NE-19 after Different Time Intervals at 25°C Sample name Droplet size (nm) Zeta potential (mV) Polydispersity index Mobility (μm cm/Vs) Electrical conductivity (mS/cm) Fresh NE-19 96.05 -37.1 0.189 -2.726 0.0141 NE-19 after 30 d 155.0 -34.2 0.208 -2.911 0.0236 NE-19 after 60 d 181.3 -34.8 0.286 -2.684 0.0269 NE-19 after 90 d 190.09 -34.0 0.277 -2.459 0.0289

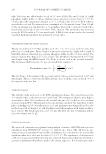
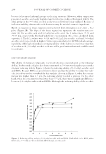
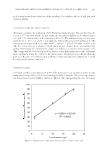
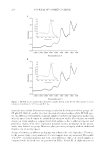
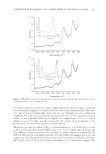
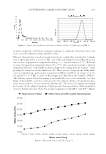
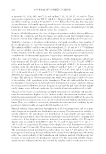
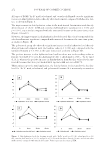
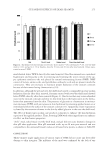
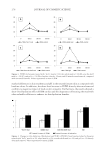
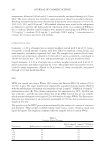
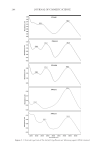
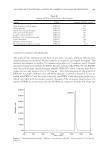
GLUTATHIONE-LOADED NANOEMULSION 263 no phase separation or inversion, cracking, creaming, or coalescence after these stress tests were selected for further storage stability studies. Physical characteristics based on visual observations confi rm that whether the formula- tion is physically stable or not (16). The color of the nanoemulsion was milky white, this was because of preparation temperature change, i.e., emulsifi cation at 25°C. With the increase of preparation temperature from 20 to 70°C, the nanoemulsion tends to develop transparency because of the emulsion droplet diameter decreasing from 10.3 μm to 51 nm, proving the formation of nanoemulsions (19). There was no change in the milky white color, no liquefaction, and no phase separation in NE-19 and B-19 on storage at 4, 25, 40, and 40°C + 75% RH over the 90-d testing period. This shows the stability of NE-19. The stability against Ostwald ripening is outstanding because of the extremely low solu- bility of the paraffi n oil in the continuous (19,20), whereas absence of liquefaction pro- vides strong evidence of nanoemulsion stability (21). The absence of liquefaction might be because of the adopted method of high-pressure homogenization. Homogenization decreases liquefaction (22). There was no phase separation in any NE-19 and B-19 samples Figure 4. Rheogra m of B-19 and NE-19 at 25°C. Figure 3. Drople t size distribution and intensity distribution data of freshly prepared NE-19.
Purchased for the exclusive use of nofirst nolast (unknown)
From: SCC Media Library & Resource Center (library.scconline.org)