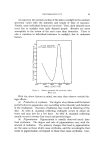
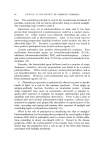
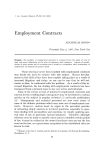
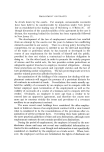
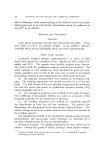
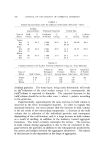
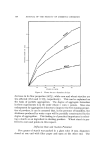
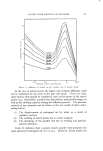
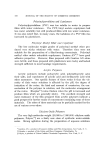
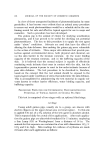
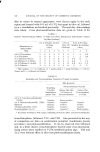
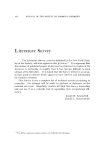
WATER VAPOR SORPTION OF STARCHES 111 ! 0.01 0.1 1 10 100% AEROSIL CONC. (LOG SCALE) Figure 5. Influence of Aerosil on the suction rate of potato starch In the case of potato starch the higher rate of linear diffusion could not be explained on the basis of the pore size alone. There are some other factors that should be considered, such as the nature of the starch grains (e.g., wettability), particle size distribution, and particle shape, as well as the swelling capacity during the diffusion process. The pressure exerted at any moment can be taken as the net result of three inter- acting forces: (1) The displacement of entrapped air by water as a result of capillary suction. (2) The swelling of starch grains due to water sorption. (3) The shrinkage of the powder bed due to wetting and particle- particle adhesion. Table II indicates that a potato starch powder bed possesses the least amount of entrapped air (2.5 cc./g.). However, it has nearly the

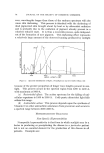
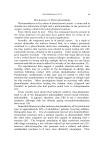
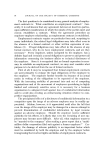
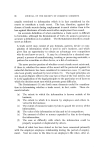
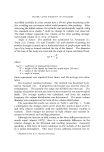
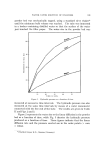
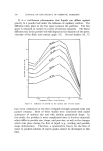
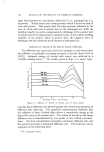
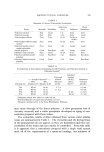
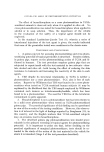
112 JOURNAL OF THE SOCIETY OF COSMETIC CHEMISTS same final pressure as corn starch, which has 7.5 cc. entrapped air/5 g. of powder. Wheat starch has a final pressure which is less than that of corn and potato. This means that the final pressure obtained in the case of wheat and corn is mainly due to the entrapped air, while the swelling capacity is nearly compensated by shrinkage of the powder bed. In potato starch the final pressure obtained is due to the evident swelling capacity of the grains, which is greater than the negative force of shrinkage and the relatively small amount of entrapped air. Influence of A erosil on the Rate of Linear Diffusion The diffusion rate experiment has been repeated on each starch after the addition of gradually increasing amounts of Aerosil (from 0.005 to 100%). Intimate mixing of Aerosil with starch was a•hieved in a Turbula shaking mixer.* The results, given in Figs. 4, 5, and 6, repre- 8 Figure 6. 165 min. 135 min. ! 0.01 0.1 1 10 100% AEROSIL CONC. (LOG SCALE) Influence of Acrosil on suction rate of wheat starch sent the linear diffusion rate plotted against the Aerosil concentration at different time intervals. The graphical representation indicates that the addition of finely divided silica effects a remarkable change in the linear flow rate in the powder bed. The action of Aerosil on the linear diffusion rate is demonstrated by two peaks or two critical concentra- tions. The first concentration represents a minimum diffusion rate, and the second represents a maximum diffusion rate. This behavior can be explained on the following basis: * W. A. Bachofen, Basel.
Purchased for the exclusive use of nofirst nolast (unknown)
From: SCC Media Library & Resource Center (library.scconline.org)