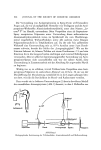
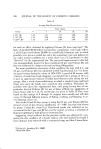
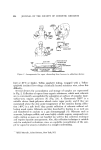
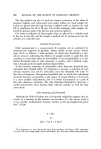
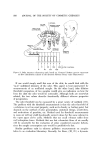
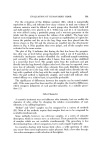
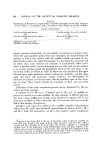
564 JOURNAL OF THE SOCIETY OF COSMETIC CHEMISTS Table II Classification of Responses on Applicability of Specific Descriptors to the Odor Character of Two Odors: 1. an Malodor ' and g. Its Mixture with a Model of an Odor Modifier b Number of Descriptors Used for realodor and mixture (•) Used for malodor but not for mixture (39) Used for mixture but not for realodor (41) Not used for either of two •Malodorant: isovaleric acid. t•Modifier: vanillin plus linalool. sensory responses of panelists, one can classify occurrences in 4 groups. Cases where the same panelist utilized the same descriptor for characterizing the malodor as well as the realodor with the modifier added, are points of sim- ilarity between these two odors. Presumably, if a descriptor has not been used for either odor, some evidence for similarity is accmnulated. Other cases, where a panelist used a certain descriptor for one odor and not for another, or in reverse, produce points for dissimilarity between the two odors. A ma- trix of the results are shown in Table II, where the total nmnber in the upper left and lower right quadrants contain evidence for similarity, and the upper right and lower left quadrants contain evidence, for dissimilarity. In this form of analysis, it is not necessary that the panelists agree on the mean- ing of terms. They merely should be consistent in their own use of the tCrlliS. • Utilization of this odor comparison process can be illustrated by the iso- valeric acid odor example. A mixture of 1.5 x 10 -0 g/1. of linalool and 3 x 10 -0 g/1. of vanillin va- pors in air served as an odor modifier. Its odor intensity at 500 ml/min flow rate from a glass sniffing port of Fig. 3 was found to be equal to 5.7. It was desired to establish to what extent the odor of isovaleric acid can be modi- fied by this mixture of fragrances. Isovaleric acid vapor was added to the modifier stimulus concentrations higher than the acid's odor threshold concentration by factors of 10 x, 40 x, and 60 x. Table III smmnarizes (at 40 x) the response matrix comparisons *Experience has shown that in the use of descriptor scales in general, panelists are somewhat more liberal in the usage of terms when exposed to scale first time. After 2 sessions and the evaluat/on of 15 to 25 odors, this tendency subsides to a reasonably constant level. In the application of the 136-descriptor scale, the sheer number of de- scriptors does not seem to present a great burden after panelists have familiarized them- selves with the terms in working with the 15 to 25 odors, which are selected in such a way that a sufficient variety of odor character notes is encountered.

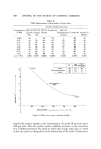
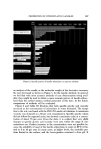
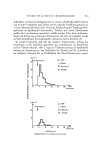
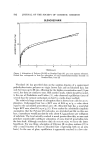
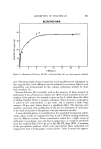
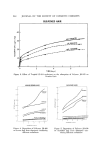
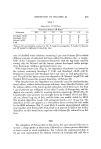
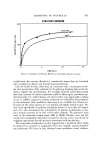
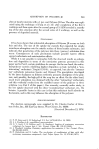
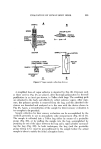
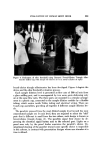
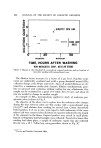
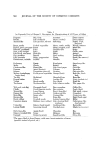
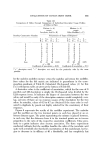
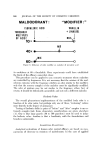
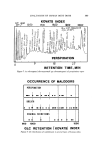
EVALUATION OF HUMAN BODY ODOR 565 Table III Comparison of Odors through Comparison of Individual Descriptor Usage Profiles of Odors in Pairs Panelist, Consecutive Number Mixture (= A) Mixture (= A) versus versus Isovaleric Acid (= B) Odor Modifier (= C) Frequencies of Types of Response a A+ A+ A-- A-- A+ A+ A-- A-- B+ B-- B+ A-- C+ C-- C+ C-- 1 2 3 4 5 6 7 8 9 Sum 1 8 7 5 4 4 4 9. 3 9. 4 1 0 11 4 2 9 4 4 0 3 2 2 3 0 11 7 9 3 3 5 1 6 1 4 7 2 3 2 0 5 6 I 3 4 2 $ 4 4 2 3 2 4 3 9.1 41 39 1123 25 38 35 1125 x'"= 109 x"• 170 Coefficient of association = 0.09 Coefficient of association = 0.14 a,,q_,, descriptor used .... descriptor not used, for the particular odor by the same panelist. for the malodor-modifier mixture versus the malodor and versus the modifier. Sum values for the left matrix are indicated in parentheses in the corre- sponding quadrants of Table II. Calculated Chi-Squared values (1) for this 2 x 2 contingency table are given at the bottom of Table III. A derivative value is the coefficient of association, which for the ease of 9 panelists and 136 descriptors is simply the Chi-Squared value divided by the 1224 response items. It indicates the degree of association between the two odors, and would be unity if the description matrices would completely over- lap, and zero if there are no common usages of the descriptors for the two odors. In actuality, values of 0.5 to 0.7 are obtained if the same odor is eval- uated in duplicate by panels not highly selected for the consistency of their responses. Figure 6 represents the results of the modifier experiment. The malodor and the modifier are the two terminal points on each bar, placed at an ar- bitrary distance apart. The point representing the mixture is plaeed between, in such way that the distances from it to the terminal points are in inverse proportion to the ratio of the respective association coefficients. Close prox- imity to a point indicates close sensory association. The three experiments conducted indicate that the modifier handles the odor of the isovaleric acid quite well at tenfold odor threshold concentration of this malodorant, but be- gins to decrease in its efficacy at 40 x thresholds, and has completely lost
Purchased for the exclusive use of nofirst nolast (unknown)
From: SCC Media Library & Resource Center (library.scconline.org)