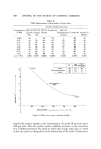
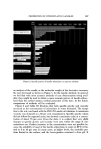
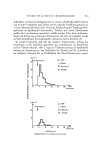
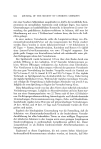
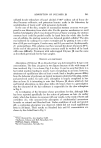
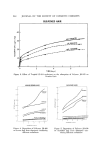
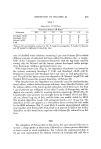
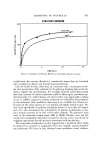
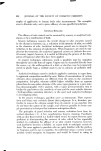
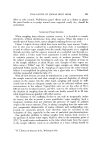
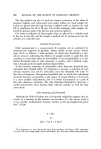
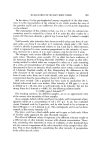
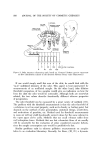
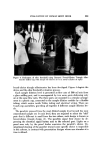
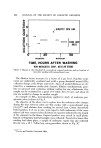
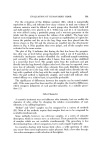
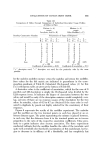
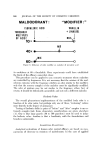
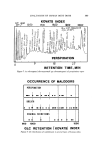
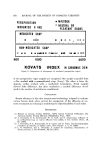
568 JOUltNAL OF THE SOCIETY OF COSMETIC CHEMISTS An analysis utilizing the above techniques results in an odorogram (6, 27, 28) a perspiration vapor odorogram is shown in Fig. 7. The areas of the GC peaks are essentially proportional to the amounts of the respective or- ganic substances in the sample, subject to GC resolution problems. The odor character of the components reflects the judg•nents of the analyst. Experi- ence has shown that there are differences in ter•ns used by different analysts, little differences with respect to what is an unpleasant odor and somewhat poorer agreement on the relative pleasantness of neutral and pleasant odor notes. In studies where many smnples of same origin must be evaluated, it is desirable to maintain the same analyst for the entire series. To interpret odorogrmns of smnples taken "before" and "after" stone treat- •nent, one compares the peak areas of those components which were found to be significant odorants. This is simple only in cases where some particular odorant is well known and its GC position is also known. Decay of concentrations of known frag- rance components after their application with some cosmetic preparation, falls into this class of relatively simple proble•ns. Similarly, there may be rare cases where the principal malodorant is known and dominates the sample odor. Usually, however, •nany malodorants participate in generating a eos•netie odor defect. A mass-speetrometrie identification of every odor-relevant GC- resolved component in every sample is prohibitive in time and effort. In such cases, series of odorograms from the same kind of sources can be com- bined to obtain a better insight into the most frequently occurring •nalodor- ants from such sources (6). Figure 8 compares GC positions of malodorants found in several types of hmnan odor sources with reasonable frequency. It appears that at least some malodorants are common to several types of sources. Hopefully, ehe•nieal identities of the malodorants indicated in Fig. 8 will be eventually established, so that odor control could be described in terms of reduction in the concentrations of stone specific chemical etonpounds. Meanwhile, odorogra•ns may be compared directly. One •nethod of com- parison is to explore how each malodorant-eaused GC peak has changed with the cosmetic treatment (6). Another •nethod, somewhat less dependent on suffleient GC resolution, is a count of malodorous peaks. When the concen- trations of malodorants decrease, the malodor of such components becomes less noticeable in the effluent from the GC column, and fewer GC peaks will be judged malodorous. Thus, if a GC peak was representing jointly a small amount of a malodorant and a larger amount of a compound that was not particularly odorous, the treahnent may have re•noved the •nalodorant and the corresponding odor remark in the odorogram, but the GC peak size may have remained almost the same. Figure 9 illustrates results of an earlier experiment conducted before the hexaehlorophene ban. Occurrences of odorous peaks in the ehro•natograms

EVALUATION OF HUMAN BODY ODOB 569 KOVATS INDEX Figure 7. An odorogram (odor-annotated gas chromatogram) of perspiration vapor OCCURRENCE OF MALODORS PERSPIRATION eee ! .e • 'eel ß ß ß ee ß ., I I i BREATH , VAGINAL SECRETIONS I I g00 1000 1500 GLC RETENTION [KOVATSJ INDEX Figure 8. GC distribution of malodorants in several types of human odors
Purchased for the exclusive use of nofirst nolast (unknown)
From: SCC Media Library & Resource Center (library.scconline.org)