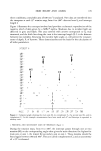
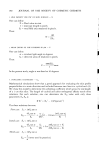
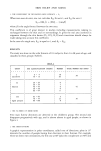
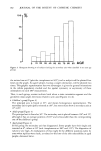
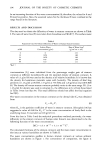
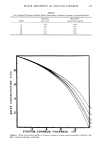
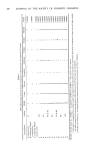
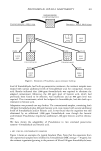
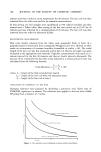
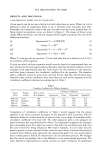
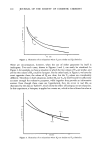
194 JOURNAL OF THE SOCIETY OF COSMETIC CHEMISTS be an increasing function of the water concentration (4) therefore, the values for A and B must be positive. Also, the assumed values for the thickness H were confined to the range found in the literature. RESULTS AND DISCUSSION The data used to obtain the diffusivity of water in stratum corneum are shown in Table I. The rates of water loss (F) were taken from Goodman and Wolf (7). The surface water Table I Parameters Used To Obtain Diffusivity of Water in Human Stratum Corneum % RH Surface Water Concentration (g/ml) Rate of Water Loss* (g/cm 2 sec x 10 7) 0 0 2.32 29 0.051 1.80 54 0.078 1.60 80 0.15 1.48 88 0.22 1.22 *Ref. 7. concentrations (Ch) were calculated from the percentage weight gain of stratum corneum at different humidities (8) and the reported density of stratum corneum. A value of 1.3 g/ml (8) was used as the density at all relative humidities. It is known that the density for keratinous materials varies with humidity. The density of fetal hog periderm is 1.25 g/ml at 0% RH, 1.37 g/ml at 75% RH, and 1.26 g/ml at near 100 % RH (6). The density of human stratum corneum probably varies in the same range. If 1.25 or 1.35 g/ml for density was used to calculate Ch, the differences in Ch'S from those listed in Table I were less than 4%. This small difference should not affect the final equation for D(C). The water concentration in the stratum corneum at the dermal side (Co) was obtained from C O = K m C', (8) where K m is the partition coefficient of water in stratum corneum. Scheuplein (10) has suggested a value of 0.88 for Km. C' is the water concentration of body fluid in the underlying tissue. It was taken as 0.94 g/ml (11). From the data in Table I and the analytical procedures outlined previously, the water diffusivity in the stratum corneum of human volar forearm was determined to be the following function of the water concentration: D(C) = 1.6 x 10 -•ø + 5.1 x 10 -•ø C 2'7. (9) The calculated thickness of the stratum corneum and the mean water concentration in the tissue at various humidities are shown in Table II. The water concentration profiles in human stratum corneum at various ambient humidities are shown in Figure 1. For convenience of comparison, the figure is

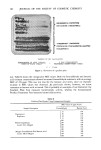
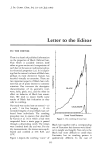
WATER DIFFUSIVITY IN STRATUM CORNEUM 195 Table II The Calculated Thickness and Mean Water Concentration of Stratum Corneum at Various Humidities % RH Thickness Mean Water (cm x 10 4) Concentration (g/ml) 0 8.6 0.50 29 11.0 0.52 54 12.1 0.53 80 12.3 0.55 88 13.9 0.58 .8 z Z.4 0 .2 .6 .8 STRATUM CORNEUM THICKNESS X/H Figure 1. Water concentration profiles in stratum corneum in various relative humidities (1:0% RH, 2:29% RH, 3:54% RH, 4:80% RH, 5:88% RH).
Purchased for the exclusive use of nofirst nolast (unknown)
From: SCC Media Library & Resource Center (library.scconline.org)