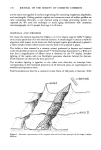
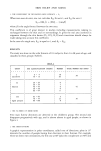
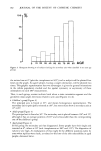
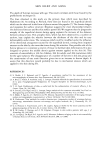
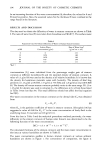
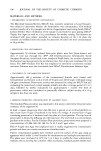
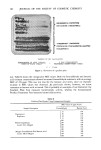
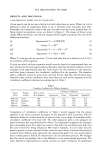
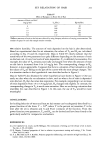
182 JOURNAL OF THE SOCIETY OF COSMETIC CHEMISTS 100' 75' 50- 25 10 20 30 40 50 60 70 80 90 AGE Figure 3. Histogram showing % of subjects lacking the secondary axis when classified in ten year age groups. the second one at 0 ø (plus the complement at 165ø), such a subject will be plotted four times on the graph. An aged subject, having a single orientation, will be plotted two times. This graphic representation has two advantages: it gives the general orientations in the whole population studied and the spatial symmetry or asymmetry of these orientations to each 180 ø measurement. Thus, in each group, arrows indicate both when a main orientation appears and the geometric mean angle directions related to arm axis (Figures 4 to 6). ß Children's group (Figure 4) The principal axis is found at 65 ø, and shows homogenous representation. The secondary axis is principally oriented at 165 ø, but some skins show a secondary axis at 15ø-195 ø . ß Adult group (Figure 5) The principal axis is found at 50 ø . The secondary axis is placed between 150 ø and 15 ø , although it has an average position of 165 ø and is less stable than the corresponding one of the children's group. ß Aged group (Figure 6) In this group, the secondary axis has disappeared. Some people have their single axis oriented at 0 ø, others at 50 ø (and complements at 180 ø and 225ø). The dispersion of values is very high. An explanation of this might be the different positions taken by arms when replicas Were made, as related to the loss of the skin extensibility in aged people, discussed latter.

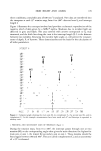
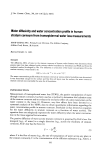
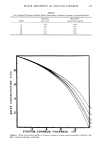
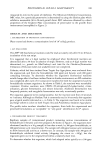
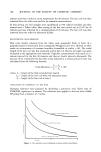
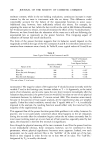
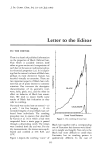
SKIN RELIEF AND AGING 183 CHILDREN 90 • lO lO 270 ø 65 ø 8 Oø ARM AXIS Figure 4. Rose of directions for children's group. Coordinate is the number of subjects having the principal or secondary axis at each 15 ø step. 3. DENSITY AND DEPTH OF FURROWS (Figures 7, 8, and 9) a) The principal axis evolution in relation to age shows a decrease of line density in the aged group (24/cm 2 -- p 0.01). In children and adults, the densities of lines are identical (29/cm 2 - p 0.01). A very important increase of mean depth of furrows with age is found. The average depth of furrows in children is 33/am - p 0.001, in adults 41/am - p 0.01, and in aged subjects 60/am - p 0.001. Sometimes, the
Purchased for the exclusive use of nofirst nolast (unknown)
From: SCC Media Library & Resource Center (library.scconline.org)