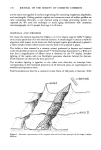
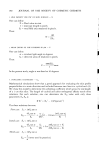
180 JOURNAL OF THE SOCIETY OF COSMETIC CHEMISTS 2. LINE DENSITY PER CM 2 OF SKIN SURFACE = N One can define: Z -- Pixel value in mm I = intercept length in pixels ST = total field area measured in pixels. Then: 10I N- ZST. 3. MEAN DEPTH OF ThE FURROWS IN •tM = P One Can define: c• = incident light angle in degrees S d = detected areas of shadows in pixels. Then: 1000ZS d P - -- tang. In the present study, angle ce was fixed at 26 degrees. 4. UNFOLDING COEFFICIENT = E M Mathematical simulations show that a good approach for evaluating the skin profile perpendicular to a main direction and included between two lines is a cycloid arch (4). We chose this model to determine the unfolding coefficient which gives the real length of a 1 cm skin slice. The length of cycloid arch after orthogonal affinity needs three solutions. For each solution, one can determine the EM value with only three parameters: ST, Sd, If K 2 = IST 2 -- 2(•rSatantx)2l The three solutions become: First case.' Sr 2 2•1'$ d tan c• Second case.' Third case.' 4Sdtanc• sT ( 2•rSdtanc•) E M -- ST -t- • •r -- 2A tan K S T 2•1'S d tan c• EM 4$ d tan oz S T 2•1'$ d tan c• 4- K -- ST -t- • + Ln 2•Sd tan c• -- K S T = 2•S d tan c• 4 EM = --(never used in practice).

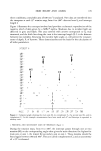
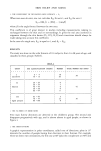
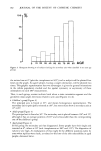
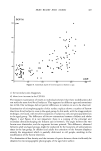
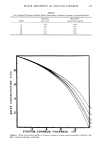
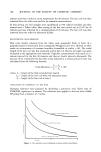
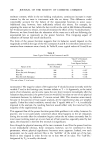
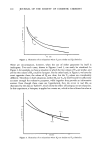
SKIN RELIEF AND AGING 181 5. 'FHE COEFFICIENT OF DEVELOPED SKIN SURFACE = S E When two axes do exist, one can calculate EMt for axis 1, and EM2 for axis 2: SE = EM• {1 + (EM2- 1) sinfi} where fi is the angie formed between the two axes. This coefficient is of great interest in studies including measurements relating to exchanges between the skin and its surroundings. It gives the real area involved in migration through the skin barrier (02, CO2, H20) and corrections should always be made taking into account this coefficient. In the case of a single axis, EM2 is equal to 1, and: SE = EMp RESULTS The study was done on the volar forearm of 116 subjects, from 2 to 98 years of age, and classified in three groups (Table I). TABLE I ( : : ) ( "GROUP : AGE CLASSIFICATION (YEARS) : NUMBER : TOTAL NUMBER PER GROUP ) ( : : : ) ( : ( I : ( Children : ( : : : ) 0 - 9 : 18 : 38 ) 10 - 15 : 20 : ) : : ) : : ) 20 - 29 : 9 : ) 30 - 39 : 7 : ) 40 - 49 : 6 : 42 ) 50 - 59 : 9 : ) 60 - 64 : 11 : ) : : ) : : ) 65 - 69 : 5 : ) 70 - 79 : 23 : 36 ) 80 -100 : 8 : ) : : ) ( : ( II : ( : ( Adults : ( : ( : ( : ( : ( III : ( : ( Aged people : ( : 1. THE NUMBER OF DIRECTIONS Two main furrow directions are detected in the children's group. The second axis disappears progressively with age, and is almost absent in aged people, as shown in Figure 3. 2. THE ORIENTATIONS A graphic representation in polar coordinates, called rose of directions, plots in 15 ø intervals the number of people having that direction to their furrows. For example, when we detect two orientations, the first one at 60 ø (plus the complement at 240 ø ) and
Purchased for the exclusive use of nofirst nolast (unknown)
From: SCC Media Library & Resource Center (library.scconline.org)